“Trade what you see; not what you think.” – The Old Fool,
Richard McCranie, trader extraordinaire.
RETAIL SALES (CNBC)
“Consumers spent at a much faster pace than expected in
September, defying expectations for a pullback amid pervasive supply chain
problems, the Census Bureau reported Friday. Retail sales for the month
increased by 0.7%...” Story at...
EMPIRE STATE MANUFACTURING (Advisor Perspectives)
“Business activity grew at a solid pace in New York
State, according to firms responding to the October 2021 Empire State
Manufacturing Survey. The headline general business conditions index fell
fifteen points to 19.8, pointing to a slower pace of growth than last month.”
Story at...
Any number above
zero indicates expansion.
UNIV OF MICHIGAN SENTIMENT (Univ of Michigan)
“Consumer sentiment has remained for the past three
months at the lows first recorded in response to last year's shutdown of the
economy. The Delta variant, supply chain shortages, and reduced labor force
participation rates will continue to dim the pace of consumer spending into
2022. There is another, less tangible factor that has contributed to the slump
in optimism: confidence in government economic policies has significantly
declined during the past six months.” Story at...
CORONAVIRUS (NTSM)
Here’s the latest from the COVID19 Johns Hopkins website
as of 5:00 PM Friday. U.S. total case numbers are on the left axis; daily
numbers are on the right side of the graph in Red with the 10-dMA of daily
numbers in Green. I added the smoothed 10-dMA of new cases (in purple) to the
chart.

MARKET REPORT / ANALYSIS
-Friday the S&P 500 rose about 0.8% to 4471.
-VIX dropped about 3% to 16.30.
-The yield on the 10-year Treasury rose to 1.575%.
The Friday run-down of some important indicators is more
strongly to the bull side (2-bear and 16-bull). These indicators tend to be
both long-term and short-term, so they are different than the 20 that I report
on daily. Details follow:
BULL SIGNS
-Cyclical Industrials (XLI-ETF) are under-performing the
S&P 500, but the curve is sharply higher so this goes in the bull category.
-The 10-dMA % of issues advancing on the NYSE
(Breadth) is above 50%.
-The 50-dMA % of issues advancing on the NYSE (Breadth)
is above 50%.
-The 100-dMA % of issues advancing on the NYSE
(Breadth) is above 50%.
-MACD of the percentage of issues advancing on the NYSE
(breadth) made a bullish crossover 23 September.
-MACD of S&P 500 price made a bullish crossover, 8
October.
-McClellan Oscillator.
-My Money Trend indicator.
-The Smart Money (late-day action) indicates the Pros are
bullish. (This indicator is based on the Smart Money Indicator developed by Don
Hayes).
-Short-term new-high/new-low data is trending higher.
-Long-term new-high/new-lows are rising.
-VIX is falling sharply.
-The smoothed advancing volume on the NYSE is rising.
-Slope of the 40-dMA of New-highs is up. This is one of
my favorite trend indicators.
-59% of the 15-ETFs that I track have been up over the
last 10-days.
-The S&P 500 is out-performing the Utilities ETF (XLU).
NEUTRAL
-There was a Hindenburg Omen signal 28 September. The McClellan Oscillator turned positive
afterward, so the Omen has been cancelled.
-There have been 2 Statistically-Significant days in the
last 15-days – too low to send a signal. This can be a bull or bear.
-Bollinger Bands
-RSI.
-Breadth on the NYSE compared to the S&P 500 index is
neutral.
-The size of up-moves has been smaller than the size of
down-moves over the last month, but not quite enough to give a signal.
-The S&P 500 is 7.2% above its 200-dMA (Bear
indicator is 12%.). This value was 15.9% above the 200-dMA when the 10%
correction occurred in Sep 2020.
-Calm-before-the-Storm Indicator – expired.
-The Fosback High-Low Logic Index is neutral.
-There have been 10 up-days over the last 20 days.
Neutral
-There have been 5 up-days over the last 10-days. Neutral
-7.7% of all issues traded on the NYSE made new, 52-week
highs when the S&P 500 made a new all-time-high 2 September. (There is no
bullish signal for this indicator.) This is above the average for all-time
highs and suggests that if we do have a pullback, it is likely to be less than
10%.
-Statistically, the S&P 500 gave a panic-signal 17
Sept. Signal has expired.
-Non-crash Sentiment indicator remains neutral, but it is
very bullish and that means the signal is leaning bearish.
-14 October, the 52-week, New-high/new-low ratio improved
by 1.25 standard deviations, somewhat bullish, but neutral.
-The 5-10-20 Timer System is HOLD; the 5-dEMA and 10-dEMA
are not both below the 20-dEMA.
BEAR SIGNS
-Distribution Days.
There have been 7 in the last 25-days. The Index almost had a Follow-Through-Day
14 Oct, but volume was not quite high enough.
-Overbought/Oversold Index (Advance/Decline Ratio) is overbought.
On Friday, 21 February, 2 days after the top of the
Coronavirus pullback, there were 10 bear-signs and 1 bull-sign. Now there
are 2 bear-signs and 16 bull-signs. Last week, there were 6 bear-signs and 9
bull-signs.
This week’s reading has jumped very strongly to the bull side.
The daily sum of 20 Indicators slipped from +9 to +8 (a
positive number is bullish; negatives are bearish); the 10-day smoothed sum
that smooths the daily fluctuations improved from -7 to +9 (These numbers
sometimes change after I post the blog based on data that comes in late.) Most
of these indicators are short-term and many are trend following.
The Long Term NTSM indicator
ensemble slipped to HOLD but it is a whisker away from a BUY signal. VIX is bullish;
Volume, Price & Sentiment indicators are neutral.
I am bullish. It’s
hard not be be with the Friday rundown of indicators looking so bullish.
MOMENTUM ANALYSIS:
TODAY’S RANKING OF 15 ETFs
(Ranked Daily)
The top ranked ETF receives
100%. The rest are then ranked based on their momentum relative to the leading
ETF.

*For additional background on
the ETF ranking system see NTSM Page at…
http://navigatethestockmarket.blogspot.com/p/exchange-traded-funds-etf-ranking.html
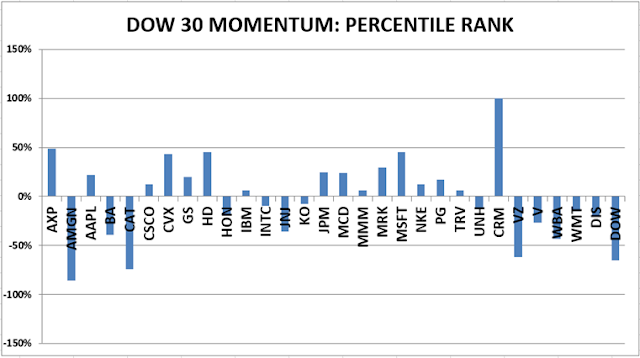
TODAY’S RANKING OF THE DOW 30
STOCKS (Ranked Daily)
Here’s the revised DOW 30 and
its momentum analysis. The top ranked stock receives 100%. The rest are then
ranked based on their momentum relative to the leading stock.
For more details, see NTSM
Page at…
https://navigatethestockmarket.blogspot.com/p/a-system-for-trading-dow-30-stocks-my_8.html
FRIDAY MARKET INTERNALS (NYSE
DATA)

Market Internals remained BULLISH on the market.
Market Internals are a decent
trend-following analysis of current market action, but should not be used alone
for short term trading. They are usually right, but they are often late. They are most useful when they diverge from
the Index.
My stock-allocation in the
portfolio is now about 50% invested in stocks; this is my “normal” fully
invested stock-allocation.
You may wish to have a higher
or lower % invested in stocks depending on your risk tolerance. 50% is a conservative
position that I consider fully invested for most retirees.
As a general rule, some
suggest that the % of portfolio invested in the stock market should be one’s
age subtracted from 100. So, a
30-year-old person would have 70% of the portfolio in stocks, stock mutual
funds and/or stock ETFs. That’s ok, but
for older investors, I usually don’t recommend keeping less than 50% invested
in stocks (as a fully invested position) since most people need some growth in
the portfolio to keep up with inflation.