“Trade what you see; not what you think.” – The Old Fool,
Richard McCranie, trader extraordinaire.
"President Trump is wrong…I had no right to overturn
the election. The presidency belongs to the American people, and the American
people alone. And frankly there is almost no idea more un-American than the
notion that any one person could choose the American president...Men and women,
if we lose faith in the Constitution, we won't just lose elections, we will
lose our country." - Mike R. Pence, VP.
“Let's face it. Let's call it what it is. Jan. 6 was a
riot that was incited by Donald Trump in an effort to intimidate Mike Pence and
the Congress into doing exactly what he said in his own words last week:
Overturn the election.” – Chris Christie, former republican Governor of NJ.
“While vital to calculating ways to survive a warming
world, climate models are hitting a wall. They are running up against the
complexity of the physics involved; the limits of scientific computing;
uncertainties around the nuances of climate behavior; and the challenge of
keeping pace with rising levels of carbon dioxide, methane and other greenhouse gases. Despite significant improvements, the new
models are still too imprecise to be taken at face value, which means
climate-change projections still require judgment calls.” - RL Holtz, WSJ
EARNINGS (FactSet)
“Overall, 56% of the companies in the S&P 500 have
reported actual results for Q4 2021 to date. Of these companies, 76% have
reported actual EPS above estimates, which is equal to the five-year average of
76%. In aggregate, companies are reporting earnings that are 8.2% above
estimates, which is slightly below the five-year average of 8.6%...The blended
(combines actual results for companies that have reported and estimated results
for companies that have yet to report) earnings growth rate for the fourth
quarter is 29.2% today... If 29.2% is the actual growth rate for the quarter,
it will mark the fourth straight quarter of earnings growth above 25% for the
index. The last time the index reported four straight quarters of earnings
growth above 25% was Q4 2009 through Q3 2010.” FactSet earnings report at...
https://insight.factset.com/sp-500-earnings-season-update-february-4-2022
GOLDMAN SAYS FOR THE FIRST TIME IN 2022 WE SEE MASSIVE
NET INFLOWS (ZeroHedge)
“So now that the bulk of earnings season has passed, and
despite some high profile tech misses - most notably Facebook - is it safe to
say that markets have finally stabilized? For the answer we go to Rubner's [Scott
Rubner, Goldman Sachs flow trader] weekly tactical flow of funds note, which
recaps where investors are putting their money to work in 2022. What is most
notable this time, is that according to Rubner, while we are still not “all
clear” after week 5, for the
first time in 2022, net demand is set to exceed net supply this coming week.”
Commentary at...
https://www.zerohedge.com/markets/goldman-first-time-2022-we-see-massive-net-inflows-stocks-week
MARKET REPORT / ANALYSIS
-Monday the S&P 500 rose about 0.4% to 4484.
-VIX declined about 1% to 22.99.
-The yield on the 10-year Treasury rose to 1.921%.
Given that most corrections retest their prior lows, I’ll
keep the pullback stats for a while.
Pullback Data:
Days since top: 24 (Avg= 30 days for corrections <10%;
60 days for larger, non-crash pullbacks)
Drop from Top: Now 6.5%; Max intraday: 12% (Avg.= 13% for
non-crash pullbacks)
The S&P 500 is 0.9% above its 200-dMA & 2.8%
below its 50-dMA.
Max Retracement from bottom: 56% Wednesday.
The slope of the 200-dMA is up.
I forgot a bullish sign in my Friday rundown of
indicators: On 31 January and 1 February there were back-to-back high volume
up-days (80% up-volume or better). That
is a bullish sign that the pullback may be over. There were a couple of
down-days afterwards so that muddies the water a little. Adding the bull-sign I
missed Friday would make the count 11-Bull to 10-Bear indicators – not much
difference. That’s a balanced indication
that shows investors are confused.
As today’s chart indicates (below), investors still haven’t
decided what to do with this market: Buy-the-dip or sell-the-rip? The Russell
2000 and the NYSE Composite were both up today while the major indices were
down. The Russell is the lowest quality index.
Seeing it lead is a bullish sign to me.
Internals were mixed.
Up-volume outpaced down-volume by about 40% and the # of stocks
advancing outpaced the decliners by about 15%. The holdout has been the
new-high/new-low data. The new-lows
outpaced new-highs by 140 issues Monday.
That was better than Friday when the spread was 193. The new-high/new-low
spread always lags, but we need to see it turn positive again soon. It was
positive Tuesday and Wednesday of last week.

I measure Sentiment as %-Bulls (Bulls/{bulls+bears})
based on the amounts invested in selected Rydex/Guggenheim mutual funds. My
Sentiment indicator is finally getting closer to a bearish, buy-zone, but it
has not given a bull signal on a 5-day basis.
I didn’t see much change in the Friday indicators as I
scanned thru my numbers today. Short-term indicators haven’t changed much
either.
The daily sum of 20 Indicators declined from +3 to +2 (a
positive number is bullish; negatives are bearish); the 10-day smoothed sum
that smooths the daily fluctuations improved from +3 to +11 (The trend
direction is more important than the actual number for the 10-day value.) These
numbers sometimes change after I post the blog based on data that comes in
late. Most of these indicators are short-term so they tend to bounce around a
lot.
The Long Term NTSM indicator
ensemble remained to HOLD. Volume is bullish; VIX, Price & Sentiment are
Neutral.
I remain cautiously bullish. The S&P 500 still needs to break back
above its 50-dMA. The bulls don’t want to see the S&P 500 fall below its
200-dMA.
POSITIONS ADDED:
Wednesday, 26 January: AAPL; XLE;
Monday, 31 January: QLD; SPY
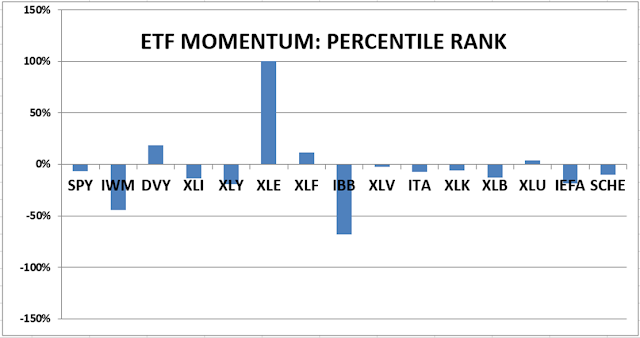
MOMENTUM ANALYSIS:
TODAY’S RANKING OF 15 ETFs
(Ranked Daily)
The top ranked ETF receives
100%. The rest are then ranked based on their momentum relative to the leading
ETF.
*For additional background on
the ETF ranking system see NTSM Page at…
http://navigatethestockmarket.blogspot.com/p/exchange-traded-funds-etf-ranking.html

TODAY’S RANKING OF THE DOW 30
STOCKS (Ranked Daily)
Here’s the revised DOW 30 and
its momentum analysis. The top ranked stock receives 100%. The rest are then
ranked based on their momentum relative to the leading stock.

For more details, see NTSM
Page at…
https://navigatethestockmarket.blogspot.com/p/a-system-for-trading-dow-30-stocks-my_8.html

MONDAY MARKET INTERNALS (NYSE
DATA)

Market Internals remained HOLD.
Market Internals are a decent
trend-following analysis of current market action, but should not be used alone
for short term trading. They are usually right, but they are often late. They are most useful when they diverge from
the Index.
My stock-allocation in the
portfolio is about 65% invested in stocks. This is above my “normal” fully
invested stock-allocation of 50%. I will hold this trading-position for a
while, but it will not be a long-term hold.
I trade about 15-20% of the
total portfolio using the momentum-based analysis I provide here. If I can see
a definitive bottom, I’ll add a lot more stocks to the portfolio using an
S&P 500 ETF.
You may wish to have a higher
or lower % invested in stocks depending on your risk tolerance. 50% is a
conservative position that I consider fully invested for most retirees.
As a general rule, some
suggest that the % of portfolio invested in the stock market should be one’s
age subtracted from 100. So, a
30-year-old person would have 70% of the portfolio in stocks, stock mutual
funds and/or stock ETFs. That’s ok, but
for older investors, I usually don’t recommend keeping less than 50% invested
in stocks (as a fully invested position) since most people need some growth in
the portfolio to keep up with inflation.