“Trade what you see; not what you think.” – The Old Fool,
Richard McCranie, trader extraordinaire.
“Faced with a combination of record speculative extremes
and deteriorating speculative conditions, investors may want to remember that
the best time to panic is before everyone else does.” – John Hussman, Phd.
PUTIN RECOGNIZES UKRAINE SEPARATISTS: ORDERS TROOPS TO
INVADE (CNBC)
“Russian President Vladimir Putin ordered troops into two
breakaway regions of eastern Ukraine after announcing Monday evening that he
would recognize their independence.” Story at...
https://www.cnbc.com/2022/02/21/putin-recognize-rebel-eastern-ukrainian-regions-as-independent.html
IHS MARKIT COMPOSITE PMI (Markit Economics)
“Growth of private sector output in the US gained
considerable momentum in February as companies reported a notable recovery in
demand from COVID-related disruptions at the start of the year. Services firms
led the rise, although manufacturers likewise registered a stronger increase in
output, buoyed by a slight easing of supply bottlenecks. However, February also
saw a survey record rise in average prices charged for goods and services.”
Report at...
https://www.markiteconomics.com/Public/Home/PressRelease/74fab5cff0d4400fb5776c46db6db6c0
CONSUMER CONFIDENCE (Conference Board)
“The Conference Board Consumer Confidence Index® fell
slightly in February, after a decrease in January...“Consumer confidence was
down slightly for a second consecutive month in February,” said Lynn Franco, Senior Director
of Economic Indicators at The Conference Board. “The Present
Situation Index improved a touch, suggesting the economy continued to expand in
Q1 but did not gain momentum. Expectations about short-term growth prospects
weakened further, pointing to a likely moderation in growth over the first half
of 2022.” Release at...
https://www.conference-board.org/topics/consumer-confidence
TRADERS MARKET CONTINUES - BEWARE JUNK (Heritage Capital)
“...Below is a crude outline of the most likely scenario
into mid-March where I think this whole decline wraps up.

...Finally, I have mentioned high yield bonds [junk] a
number of times and their unusual plunge...If you can only watch one single
thing now, this is the one to watch.” Paul Schatz, President heritage Capital.
Commentary at...
https://investfortomorrow.com/blog/traders-market-continues-beware-junk/
The bottom on this guess would be around 4166. That would
match the June 2021 low.
VALUATION

Valuation is better, but that doesn’t mean that it isn’t
still at extreme levels.
UTILITIES ARE OUTPERFORMING THE S&P 500 (NTSM)

The red line on the chart is the spread between Utilities
and the S&P 500. Below zero means Utilities are outperforming the S&P
500; a falling line means the trend is getting worse. This is a bearish indication.
MARKET REPORT / ANALYSIS
-Tuesday the S&P 500 fell about 1% to 4305, dropping
below the prior correction low.
-VIX rose about 4% to 28.81.
-The yield on the 10-year Treasury rose to 1.944%.
Given that most corrections retest their prior lows, I’ll
keep the pullback stats.
Pullback Data:
Days since top: 34 (Avg= 30 days top to bottom for
corrections <10%; 60 days top to bottom for larger, non-crash pullbacks)
Drop from Top: Now 10.3%; Max closing: 9.8%; Max
intraday: 12% (Avg.= 13% for non-crash pullbacks)
The S&P 500 is 3.4% BELOW its 200-dMA & 6.0% BELOW
its 50-dMA.
Max Retracement from bottom: 56% 2 Feb.
The slope of the 200-dMA is up, but just barely.
Volume has been picking up over the last 4 or 5 days. I have
been wondering whether we’d see another huge-volume, down-day. Look for it; it
might signal a bottom, or be close to the bottom.
The daily sum of 20 Indicators dropped from -4 to -7 (a
positive number is bullish; negatives are bearish); the 10-day smoothed sum
that smooths the daily fluctuations dropped from -19 to -28 (The trend
direction is more important than the actual number for the 10-day value.) These
numbers sometimes change after I post the blog based on data that comes in
late. Most of these indicators are short-term so they tend to bounce around a
lot.
The Long Term NTSM indicator
ensemble remained to SELL. Volume & VIX are bearish; Price & Sentiment
are Neutral.
Tuesday, we got the lower low on the S&P 500, but the
numbers weren’t encouraging. Volume was higher and internals were weak too. No
bottom yet. As I noted above, it may take a high volume down day to put an end
the correction. The market needs to
scare out the remaining investors before it can move on.
I did notice one bullish sign: at Today’s test of the 27
Jan low, 27% of the ETFs I track in the momentum analysis were above their
120-dMAs. At the 27 Jan low, 13% of those ETFs were above their 120-dMAs. So,
there is some improvement in the markets even though the S&P 500 has traded
back to its prior low. Overall though, there is not much to cheer in today’s
data.
The Russian Commies have invaded Ukraine; the cold-war détente
is over. The market may take a while to digest that news, but I'll keep
watching the indicators and bottom signs. Hopefully, I’ll be able to call a
bottom when it arrives. The S&P 500 has dropped to its 4 Oct 2021 low
around 4300. There are a number of small support levels below this level and
major support in the 4100 area, about 5% lower than today’s close. It’s
possible the markets may not fall much further...
...but until we see some more bullish signs, I am
bearish.
TRADING POSITIONS:
XLE; Purchased Wednesday, 26 January. I may sell the
position soon since I don’t want to take a loss. Energy had been holding up pretty
well, but not over the last week or so.
MOMENTUM ANALYSIS:
TODAY’S RANKING OF 15 ETFs
(Ranked Daily)
The top ranked ETF receives
100%. The rest are then ranked based on their momentum relative to the leading
ETF.

*For additional background on
the ETF ranking system see NTSM Page at…
http://navigatethestockmarket.blogspot.com/p/exchange-traded-funds-etf-ranking.html

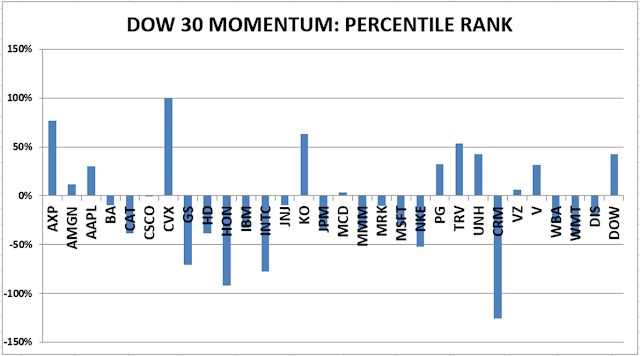
TODAY’S RANKING OF THE DOW 30 STOCKS (Ranked Daily)
Here’s the revised DOW 30 and
its momentum analysis. The top ranked stock receives 100%. The rest are then
ranked based on their momentum relative to the leading stock.
For more details, see NTSM Page at…
https://navigatethestockmarket.blogspot.com/p/a-system-for-trading-dow-30-stocks-my_8.html

Home Depot dropped 9% today.
TUESDAY MARKET INTERNALS (NYSE
DATA)

Market Internals are a decent
trend-following analysis of current market action, but should not be used alone
for short term trading. They are usually right, but they are often late. They are most useful when they diverge from the
Index.
I trade about 15-20% of the
total portfolio using the momentum-based analysis I provide here. If I can see
a definitive bottom, I’ll add a lot more stocks to the portfolio using an
S&P 500 ETF.
You may wish to have a higher
or lower % invested in stocks depending on your risk tolerance. 50% is a conservative
position that I consider fully invested for most retirees.
As a general rule, some
suggest that the % of portfolio invested in the stock market should be one’s
age subtracted from 100. So, a
30-year-old person would have 70% of the portfolio in stocks, stock mutual
funds and/or stock ETFs. That’s ok, but
for older investors, I usually don’t recommend keeping less than 50% invested
in stocks (as a fully invested position) since most people need some growth in
the portfolio to keep up with inflation.