“Trade what you see; not what you think.” – The Old Fool,
Richard McCranie, trader extraordinaire.
FOMC MINUTES (CNBC)
“Federal Reserve officials set plans into motion at their
most recent meeting to begin raising interest rates and shed the trillions of
dollars in bonds on the central bank balance sheet, according to minutes
released Wednesday. Some officials at the meeting expressed concerns over
financial stability, saying that loose monetary policy could be posing a
substantial risk.” Story at...
https://www.cnbc.com/2022/02/16/federal-reserve-releases-minutes-from-its-january-meeting.html
The markets apparently liked the FED minutes since the
S&P 500 jumped more than 1% higher after the release.
RETAIL SALES (CNBC)
“Consumer spending bounced back sharply in January as
rising inflation and a post-holiday surge kept cash registers ringing...Retail
sales for the month rose 3.8%...”
Story at...
https://www.cnbc.com/2022/02/16/retail-sales-january-2022.html
INDUSTRIAL PRODUCTION (fxStreet.com)
“Data released on Wednesday showed Industrial Production
in January increased 1.4% above the 0.4% of market consensus. Analysts at Wells
Fargo explained that “a 9.9% surge in utility output amid the big chill in
January explains the beat.” Story at...
EIA CRUDE INVENTORIES (EIA)
“U.S. commercial crude oil inventories (excluding those
in the Strategic Petroleum Reserve) increased by 1.1 million barrels from the
previous week. At 411.5 million barrels, U.S. crude oil inventories are about
10% below the five-year average for this time of year.” Report at...
https://ir.eia.gov/wpsr/wpsrsummary.pdf
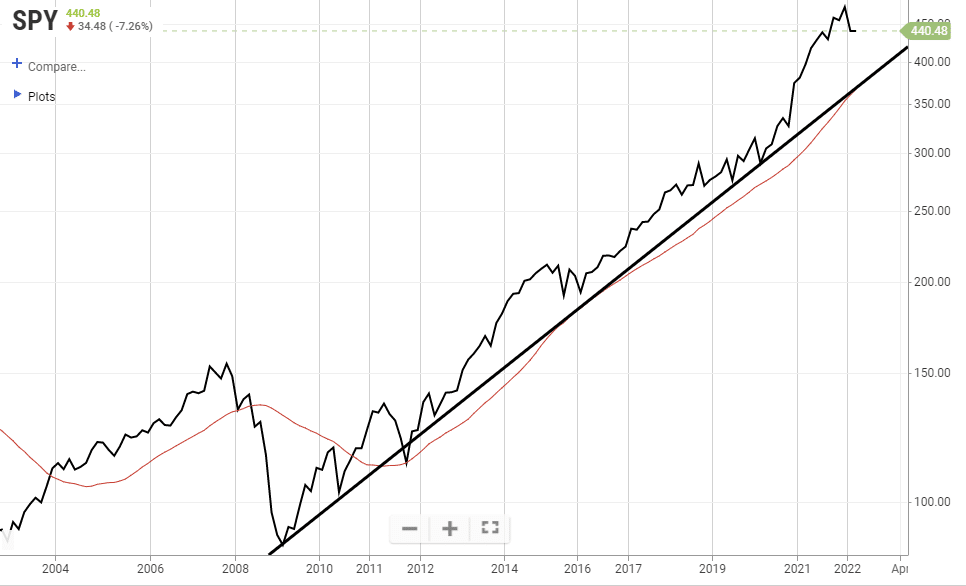
MARKET PULLBACK OR BEAR MARKET (RIA)
“After a long period
of only 5% drawdowns, the 10% market pullback in
January “felt” like a crash. However, if we go back to 2009 and
draw a trendline along the 24-week moving average, we see the recent correction
has done little to violate that bullish trend...

...Making a “one-sided” bet on a potential
outcome harbors an outsized risk of being wrong. Such
would potentially impact client capital and damage financial outcomes...While
we are reducing capital risk opportunistically, we are very aware we could give
up performance in the short term if the market rallies. For us, that is a
choice we can live with if we potentially bypass the risk of a more significant
correction.” Commentary at...
https://realinvestmentadvice.com/market-pullback-or-bear-market/
NO MAN’S LAND, PATIENCE REQUIRED (Heritage Capital)
“...we want to see how much, if any, of Tuesday’s gains
are given back this week. The longer the market can hang in and not give back,
the more likely an upside resolution. Giving back all of Tuesday’s gains
quickly, would signal a return to the lower end of the post-January 24th range.”
Commentary at...
https://investfortomorrow.com/blog/no-mans-land-patience-required/
MARKET REPORT / ANALYSIS
-Wednesday the S&P 500 rose about 0.1% to 4475.
-VIX fell about 5% to 24.29.
-The yield on the 10-year Treasury slipped to 2.042%.
Given that most corrections retest their prior lows, I’ll
keep the pullback stats for a while.
Pullback Data:
Days since top: 31 (Avg= 30 days top to bottom for
corrections <10%; 60 days top to bottom for larger, non-crash pullbacks)
Drop from Top: Now 6.7%; Max closing: 9.8%; Max intraday:
12% (Avg.= 13% for non-crash pullbacks)
The S&P 500 is 0.4% ABOVE its 200-dMA & 2.8%
below its 50-dMA.
Max Retracement from bottom: 56% 2 Feb.
The slope of the 200-dMA is up, but just barely.
I’ve been watching the Russell 2000 as a tell for the
market. If the worst quality index can
lead higher, then it seems like the S&P 500 should follow. With that in
mind, I’d like to see the Russell move above its recent high. The Russell 2000 did
break above its recent high of 2084 Wednesday, but couldn’t hold that level and
closed at 2079. That doesn’t tell us much.
We’ll just have to watch tomorrow.
The S&P 500 would still need to move up 2.5% to match
its recent high of 4589 on 2 Feb.
The daily sum of 20 Indicators improved from -9 to -6 (a
positive number is bullish; negatives are bearish); the 10-day smoothed sum
that smooths the daily fluctuations dropped from +9 to -6 (The trend direction
is more important than the actual number for the 10-day value.) These numbers
sometimes change after I post the blog based on data that comes in late. Most
of these indicators are short-term so they tend to bounce around a lot.
The Long Term NTSM indicator
ensemble remained HOLD. Volume is bearish; Price, VIX & Sentiment are
Neutral.
The FED minutes were benign and markets bounced up after
the release at 2pm. Ukraine is looking less worrisome, but still not fully
resolved. On the whole I’d have to say the news is out and the market is digesting
it pretty well.
There are at least 3 signs that I am looking for that
might get me back in the market. I want to see significant improvement in: New-high,
new-low data; my Market Internal ensemble; and Money Trend.
Until we see some more bulIish signs, I am bearish.
POSITIONS ADDED:
Wednesday, 26 January: AAPL; XLE;
Monday, 31 January: QLD; SPY
POSITIONS SOLD:
QLD, 10 February.
APPL, 11 February
SPY, 14 February
MOMENTUM ANALYSIS:
TODAY’S RANKING OF 15 ETFs
(Ranked Daily)
The top ranked ETF receives
100%. The rest are then ranked based on their momentum relative to the leading
ETF.

*For additional background on
the ETF ranking system see NTSM Page at…
http://navigatethestockmarket.blogspot.com/p/exchange-traded-funds-etf-ranking.html
TODAY’S RANKING OF THE DOW 30
STOCKS (Ranked Daily)
Here’s the revised DOW 30 and
its momentum analysis. The top ranked stock receives 100%. The rest are then
ranked based on their momentum relative to the leading stock.

For more details, see NTSM
Page at…
https://navigatethestockmarket.blogspot.com/p/a-system-for-trading-dow-30-stocks-my_8.html
WEDNESDAY MARKET INTERNALS
(NYSE DATA)
A basket of Market Internals remained SELL.

Market Internals are a decent trend-following
analysis of current market action, but should not be used alone for short term
trading. They are usually right, but they are often late. They are most useful when they diverge from
the Index.
My stock-allocation in the portfolio
is about 40% invested in stocks. This is below my “normal” fully invested
stock-allocation of 50%.
I trade about 15-20% of the
total portfolio using the momentum-based analysis I provide here. If I can see
a definitive bottom, I’ll add a lot more stocks to the portfolio using an
S&P 500 ETF.
You may wish to have a higher
or lower % invested in stocks depending on your risk tolerance. 50% is a
conservative position that I consider fully invested for most retirees.
As a general rule, some suggest
that the % of portfolio invested in the stock market should be one’s age
subtracted from 100. So, a 30-year-old
person would have 70% of the portfolio in stocks, stock mutual funds and/or
stock ETFs. That’s ok, but for older
investors, I usually don’t recommend keeping less than 50% invested in stocks
(as a fully invested position) since most people need some growth in the
portfolio to keep up with inflation.