“Trade what you see; not what you think.” – The Old Fool,
Richard McCranie, trader extraordinaire.
CONGRESS WOULDN’T LIE TO US WOULD THEY???
“...the respected Wharton School at the University of Pennsylvania has found that the Inflation Reduction Act would actually have no impact on inflation.” Jonathon Turley at...
https://jonathanturley.org/2022/07/30/statistically-indistinguishable-from-zero-wharton-study-finds-the-inflation-reduction-act-will-have-no-impact-on-inflation/
Here are 2 completely opposite views on the current
market, both from respected Professional financial experts:
STOCKS WILL SOON BE GROUNDED (msn.com)
“We remain of view this is a bear rally,” the [Bank of America] analysts wrote in their weekly commentary about investment flows. They said they would sell stocks if the S&P 500 exceeds 4,200, which would represent a 1.5% rise above the recent level of 4,138. The index’ “true lows” are below 3,600, down 13% from the recent level, the strategists said. To be sure, “it makes sense” that stocks...Bond funds enjoyed an influx of $3.6 billion last week, the largest since March, BofA said. But “Treasuries say it’s too early to position for a dovish Fed pivot,” the strategists said.
Stocks' Ascent Will Soon be Grounded: Bank of America (msn.com)
POSSIBLE 18% SURGE INTO NEW YEAR – 2022 BEAR MARKET IS
OVER SAYS TOM LEE (Business Insider)
"The biggest takeaway for me on events of this week? Convincing and arguably decisive evidence the 'bottom is in' — the 2022 bear market is over," he [Tom Lee of Fundstradt] said. Lee's confidence stems from the fact that between a negative GDP print, another 75-basis-point interest rate hike from the Fed, and more natural gas volatility due to Russia's Nord Stream pipeline drama, a lot of bad news occurred this week and yet the S&P 500 and Nasdaq 100 managed to stage a 3% rally.” Story at...
https://markets.businessinsider.com/news/stocks/stock-market-outlook-bear-market-over-new-sp500-highs-fundstrat-2022-7
MARKET REPORT / ANALYSIS
-Monday the S&P 500 slipped about 0.3% to 4119.
-VIX rose about 7% to 22.84.
-The yield on the 10-year Treasury slipped to 2.545%.
PULLBACK DATA:
-Drop from Top: 14.1% as of today. 23.6% max.
-Trading Days since Top: 144-days.
The S&P 500 is 5.2% Below its 200-dMA & closed 4.9% Above its 50-dMA. It also closed slightly below its 100-dMA Friday.
*I won’t call the correction over until the S&P 500
makes a new-high; however, we hope to be able to call the bottom when we see
it.
MY TRADING POSITIONS:
SH, short the S&P 500 ETF.
SSO – 2x Long S&P 50 ETF. Talk about confusion! This is a short-term play to hedge the short position.
TODAY’S COMMENT:
If the Pros can’t agree, what the Hell is the world coming to? As we noted Friday, “...indicators remain to the Bull side (6-bear and 18-bull).” Still, how can we be overly bullish with the FED just getting started; the economy is slowing; there are serious issues in Europe; and the Chinese economy is iffy? I can’t, even as the indicators show the market getting healthier.
A couple of the bear signs from Friday have vanished:
-Buying Pressure minus Selling Pressure ticked down Friday, but has resumed its upward trend today.
-Bollinger Bands were overbought Friday, but weren’t overbought today. We’d need to see more top indicators than just Bollinger Bands before taking action anyway.
The biggest concerns for the Bulls in my indicators are: (1)
The Smart Money (based on late-day action) has turned down. (2) The Long-term
new-high/new-low data remains bearish. Even now, new-52-week lows are outpacing
new-52-week highs. That’s not a recipe
for a sustained bull market. Of course, it could always change.
As I am writing this, “news-flash” is that Asia stocks
markets are falling badly, 0.6% to 3%, depending on which country you look at.
US futures are down in sympathy. That’s
not a prediction that the rally is over. It could be, but indicators
still look good.
Today, the daily sum of 20 Indicators remained +13 (a positive number is bullish; negatives are bearish); the 10-day smoothed sum that smooths the daily fluctuations improved from +106 to +11. (The trend direction is more important than the actual number for the 10-day value.) These numbers sometimes change after I post the blog based on data that comes in late. Most of these 20 indicators are short-term so they tend to bounce around a lot.
The S&P 500 is still sitting at its 100-dMA, but it
is not impossible for the Index to reach the 200-dMA. This still looks like a
rally in a bear market, but I think 4300 is a good target for the rally, somewhat
below the 200-dMA.
LONG-TERM INDICATOR: The Long
Term NTSM indicator remained BUY: PRICE, SENTIMENT & VOLUME are bullish; VIX
is neutral. I still expect the S&P 500 to test its prior low of 3667, but
it may be possible to trade this market now, but remember for the longer-term,
one indicator trumps them all – “Don’t fight the FED.”
I am not convinced that the
FED will pivot soon and Fed Governors said as much in interviews I saw today.
I’m a Bear longer-term; short-term the bulls remain in
charge. FOMO (fear of missing out) is still not done.
BEST ETFs - MOMENTUM ANALYSIS:
TODAY’S RANKING OF 15 ETFs (Ranked Daily)

*For additional background on the ETF ranking system see NTSM Page at…
http://navigatethestockmarket.blogspot.com/p/exchange-traded-funds-etf-ranking.html

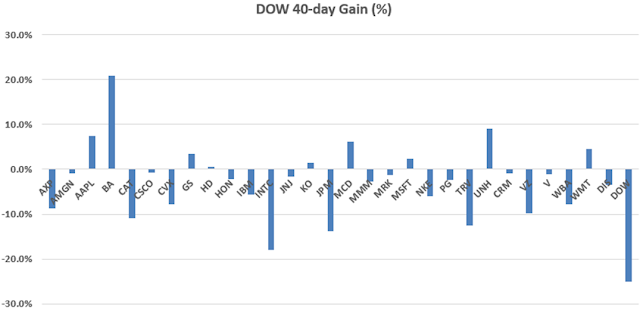
BEST DOW STOCKS - TODAY’S MOMENTUM RANKING OF THE DOW 30 STOCKS (Ranked Daily)
Here’s the revised DOW 30 and its momentum analysis. The top ranked stock receives 100%. The rest are then ranked based on their momentum relative to the leading stock.

For more details, see NTSM Page at…
https://navigatethestockmarket.blogspot.com/p/a-system-for-trading-dow-30-stocks-my_8.html
MONDAY MARKET INTERNALS (NYSE DATA)
 My basket of Market Internals remained BUY.
(Market Internals are a decent trend-following
analysis of current market action, but should not be used alone for short term
trading. They are most useful when they diverge from the Index.)

My stock-allocation in the
portfolio is now roughly 40% invested in stocks.
I trade about 15-20% of the
total portfolio using the momentum-based analysis I provide here. If I can see
a definitive bottom, I’ll add a lot more stocks to the portfolio using an
S&P 500 ETF.
“...the respected Wharton School at the University of Pennsylvania has found that the Inflation Reduction Act would actually have no impact on inflation.” Jonathon Turley at...
https://jonathanturley.org/2022/07/30/statistically-indistinguishable-from-zero-wharton-study-finds-the-inflation-reduction-act-will-have-no-impact-on-inflation/
STOCKS WILL SOON BE GROUNDED (msn.com)
“We remain of view this is a bear rally,” the [Bank of America] analysts wrote in their weekly commentary about investment flows. They said they would sell stocks if the S&P 500 exceeds 4,200, which would represent a 1.5% rise above the recent level of 4,138. The index’ “true lows” are below 3,600, down 13% from the recent level, the strategists said. To be sure, “it makes sense” that stocks...Bond funds enjoyed an influx of $3.6 billion last week, the largest since March, BofA said. But “Treasuries say it’s too early to position for a dovish Fed pivot,” the strategists said.
Stocks' Ascent Will Soon be Grounded: Bank of America (msn.com)
"The biggest takeaway for me on events of this week? Convincing and arguably decisive evidence the 'bottom is in' — the 2022 bear market is over," he [Tom Lee of Fundstradt] said. Lee's confidence stems from the fact that between a negative GDP print, another 75-basis-point interest rate hike from the Fed, and more natural gas volatility due to Russia's Nord Stream pipeline drama, a lot of bad news occurred this week and yet the S&P 500 and Nasdaq 100 managed to stage a 3% rally.” Story at...
https://markets.businessinsider.com/news/stocks/stock-market-outlook-bear-market-over-new-sp500-highs-fundstrat-2022-7
-Monday the S&P 500 slipped about 0.3% to 4119.
-VIX rose about 7% to 22.84.
-The yield on the 10-year Treasury slipped to 2.545%.
-Drop from Top: 14.1% as of today. 23.6% max.
-Trading Days since Top: 144-days.
The S&P 500 is 5.2% Below its 200-dMA & closed 4.9% Above its 50-dMA. It also closed slightly below its 100-dMA Friday.
SH, short the S&P 500 ETF.
SSO – 2x Long S&P 50 ETF. Talk about confusion! This is a short-term play to hedge the short position.
If the Pros can’t agree, what the Hell is the world coming to? As we noted Friday, “...indicators remain to the Bull side (6-bear and 18-bull).” Still, how can we be overly bullish with the FED just getting started; the economy is slowing; there are serious issues in Europe; and the Chinese economy is iffy? I can’t, even as the indicators show the market getting healthier.
-Buying Pressure minus Selling Pressure ticked down Friday, but has resumed its upward trend today.
-Bollinger Bands were overbought Friday, but weren’t overbought today. We’d need to see more top indicators than just Bollinger Bands before taking action anyway.
Today, the daily sum of 20 Indicators remained +13 (a positive number is bullish; negatives are bearish); the 10-day smoothed sum that smooths the daily fluctuations improved from +106 to +11. (The trend direction is more important than the actual number for the 10-day value.) These numbers sometimes change after I post the blog based on data that comes in late. Most of these 20 indicators are short-term so they tend to bounce around a lot.
BEST ETFs - MOMENTUM ANALYSIS:
TODAY’S RANKING OF 15 ETFs (Ranked Daily)
*For additional background on the ETF ranking system see NTSM Page at…
http://navigatethestockmarket.blogspot.com/p/exchange-traded-funds-etf-ranking.html
BEST DOW STOCKS - TODAY’S MOMENTUM RANKING OF THE DOW 30 STOCKS (Ranked Daily)
Here’s the revised DOW 30 and its momentum analysis. The top ranked stock receives 100%. The rest are then ranked based on their momentum relative to the leading stock.
For more details, see NTSM Page at…
https://navigatethestockmarket.blogspot.com/p/a-system-for-trading-dow-30-stocks-my_8.html
MONDAY MARKET INTERNALS (NYSE DATA)