Best DOW Stocks ... Best ETFs … Stock Market Analysis ... Jobs Report Was BS ... Housing Recession Coming
“Trade what you see; not what you think.” – The Old Fool,
Richard McCranie, trader extraordinaire.
“These are dark times for our Nation, as my beautiful home,
Mar-A-Lago in Palm Beach, Florida, is currently under siege, raided, and
occupied by a large group of FBI agents. Nothing like this has ever happened to
a President of the United States before.” - Former President Donald Trump.
MISH SHEDLOCK SAYS THE “AMAZING JOBS REPORT [Friday] IS
BS (Mish Talk)
Nonfarm Payrolls vs Employment Level.
Chart by Mish. One set of numbers is wrong.
“The economy added a much higher than expected 528,000
[jobs as reported by BLS Friday]. This
follows a much higher than expected 372,000 jobs in June. But the
discrepancy between jobs and employment is amazing...The payroll survey
(sometimes called the establishment survey) is the headline jobs number,
generally released the first Friday of every month. It is based on employer
reporting...The household survey is a phone survey conducted by the BLS. It
measures unemployment and many other factors...it's worth noting that for the
second month full-time employment has declined. In March, the BLS said
full-time employment was 132,718,000. Today it says 132,577,00. Again we see huge
divergences between the two reports.” - Mike Shedlock, registered investment
advisor for SitkaPacific Capital Management. Commentary at...
https://mishtalk.com/economics/another-big-jobs-blowout-are-the-numbers-believable-or-will-there-be-revisions
NVIDIA WARNS OF LOWER 2ND QUARTER REVENUE
(YahooFinance)
“Nvidia Corp on Monday warned its second-quarter revenue
would drop by 19% from the prior quarter on weakness in its gaming business,
sending the chip designer's shares down about 5% in early trading.” Story at...
https://finance.yahoo.com/news/nvidia-expects-second-quarter-revenue-130741568.html
The stock was down about 7% this morning around 11am.
HOUSING RECESSION COMING – NAHB CEO (msn.com)
“We’re heading into a recession,” NAHB [National
Association of Home Builders] CEO Jerry Howard told Bloomberg in
a recent interview. He described how a rapid decline in homebuilding and demand
for new homes could drag the national economy lower.” Story at...
‘We’re
heading into a housing recession’: Here’s what the NAHB CEO sees in real estate
right now — and why it spells trouble for the economy (msn.com)
MARKET REPORT / ANALYSIS
-Monday the S&P 500 slipped about 0.1% to 4140.
-VIX rose about 1% to 21.29.
-The yield on the 10-year Treasury slipped to 2.752%.
PULLBACK DATA:
-Drop from Top: 13.7% as of today. 23.6% max.
-Trading Days since Top: 149-days.
The S&P 500 is 4.5% Below its 200-dMA & closed 4.9%
Above its 50-dMA. It also closed about ½% above its 100-dMA.
-Resistance points for the rally, are: (1) 4175, the June
highs; (2) 4240, the 50% retracement point (top to bottom); (3) 4342 & 4350,
the 200-dMA & upper longer-term trend line, respectively; (4) or 4370, the
62% Fibonacci retracement point for those who believe in that sort of thing.
*I won’t call the correction over until the S&P 500
makes a new-high; however, we hope to be able to call the bottom when we see
it.
MY TRADING POSITIONS:
SH, short the S&P 500 ETF.
TODAY’S COMMENT:
Finally, we see that the new-52-week-highs have outpaced
the new-52-week-lows. That’s a nice bullish sign. Overall, internals improved
today but the S&P 500 was down.
Usually, it portends an up-day tomorrow. We’ll see.
I was watching the June high levels at 4175 to see if the
Index could make a bullish break above that resistance point. So far, it has
not managed to do it.
Selling Pressure is now outpacing Buying Pressure, so we
have another bear sign to add to Friday’s total.
While I don’t treat this as an indicator, the 200-dMA of
the S&P 500 is still falling.
The Index is just above its 100-dMA and that point is now
support; bulls don’t want to see the Index fall below its 100d-MA.
Today, the daily sum of 20 Indicators improved from +7 to
+11 (a positive number is bullish; negatives are bearish); the 10-day smoothed
sum that smooths the daily fluctuations improved from +87 to +91. (The trend
direction is more important than the actual number for the 10-day value.) These
numbers sometimes change after I post the blog based on data that comes in
late. Most of these 20 indicators are short-term so they tend to bounce
around a lot.
LONG-TERM INDICATOR: The Long
Term NTSM indicator remained BUY: VIX, PRICE & VOLUME are bullish;
SENTIMENT is neutral. I still expect the S&P 500 to test its prior low of
3667. Remember for the longer-term, one indicator trumps them all – “Don’t
fight the FED.”
I’m a Bear longer-term; short-term, the bulls seem to be
back control of the markets, but that is in question now. Since I sold SSO last
week, I have reduced stock exposure. For me, it’s all about 4175 (June highs).
Can the Index break above that level?
The markets may be one piece of bad news from a market
rout. I don’t know what that news may be, but it wouldn’t take much to kill the
rally.
BEST ETFs - MOMENTUM ANALYSIS:
TODAY’S RANKING OF 15 ETFs
(Ranked Daily)
*For additional background on
the ETF ranking system see NTSM Page at…
http://navigatethestockmarket.blogspot.com/p/exchange-traded-funds-etf-ranking.html
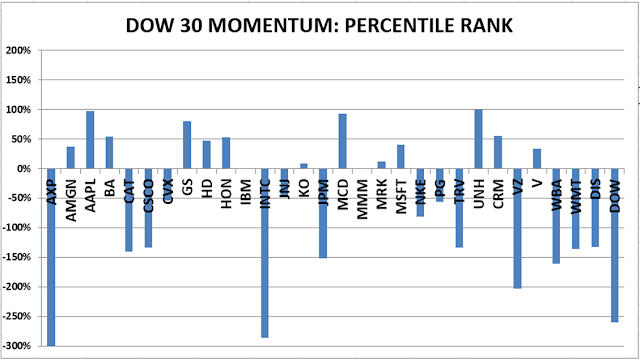
BEST DOW STOCKS - TODAY’S MOMENTUM
RANKING OF THE DOW 30 STOCKS (Ranked Daily)
Here’s the revised DOW 30 and
its momentum analysis. The top ranked stock receives 100%. The rest are then
ranked based on their momentum relative to the leading stock.
For more details, see NTSM
Page at…
https://navigatethestockmarket.blogspot.com/p/a-system-for-trading-dow-30-stocks-my_8.html
MONDAY MARKET INTERNALS (NYSE
DATA)
My basket of Market Internals remained BUY.
(Market Internals are a decent trend-following
analysis of current market action, but should not be used alone for short term
trading. They are most useful when they diverge from the Index.)
My stock-allocation in the
portfolio is now roughly 30% invested in stocks.
I trade about 15-20% of the
total portfolio using the momentum-based analysis I provide here. If I can see
a definitive bottom, I’ll add a lot more stocks to the portfolio using an
S&P 500 ETF.