“Trade what you see; not what you think.” – The Old Fool, Richard McCranie, trader extraordinaire.
“Stocks plummeted Friday after Federal Reserve Chair Jerome Powell said in his Jackson Hole speech the central bank won’t back off in its fight against rapid inflation... Powell reiterated a tough stance against inflation, spurring investors to weigh the implications of higher interest rates kept in place for a longer time.” Story at...
https://www.cnbc.com/2022/08/25/stock-market-futures-open-to-close-news.html
“The BEA's Personal Income and Outlays report for July 2022 was weaker than expected on both the spending and income side. The saving grace from a GDP standpoint was a reported month-over-month inflation rate of -0.1 percent.” Story at...
https://mishtalk.com/economics/personal-income-and-spending-in-july-badly-miss-economists-estimates
“A key measure of inflation closely watched by U.S. policymakers showed that price increases slowed in July, the Bureau of Economic Analysis said Friday. The personal consumption expenditures price index came in with a year-over-year rise of 6.3% in July, down from 6.8% in June. The index actually fell 0.1% month over month.” Story at...
https://www.cnbc.com/2022/08/26/feds-preferred-inflation-measure-shows-price-pressures-eased-in-july.html
“The final August reading continued the early month improvement in consumer sentiment, rising 13.0% above July but remaining 17% below a year ago. Most of this increase was concentrated in expectations, with a 59% surge in the year-ahead outlook for the economy following two months at its lowest reading since the Great Recession...” Press release at...
http://www.sca.isr.umich.edu/
-Friday the S&P 500 fell about 3.4% to 4058.
-VIX rose about 17% to 25.56.
-The yield on the 10-year Treasury was little changed at 3.043%.
-Drop from Top: 15.4% as of today. 23.6% max.
-Trading Days since Top: 163-days.
The S&P 500 is 5.8% Below its 200-dMA & closed 1.5% Above its 50-dMA.
-A support point for the rally is 3996, the 50-dMA.
SH, short the S&P 500 ETF.
SDS, 2x short S&P 500 ETF.
I don’t understand why there was a surprise that the Fed is serious about inflation. Seems obvious to me. Perhaps the charts will help convince investors.
-Overbought/Oversold Index (Advance/Decline Ratio).
-The 50-dMA percentage of issues advancing on the NYSE (Breadth) is above 50.
-Long-term new-high/new-low data.
-The longer-term, 50-dEMA, Fosback Hi-Low Logic Index is Bullish.
-The size of up-moves has been larger than the size of down-moves over the last month.
-MACD of the percentage of issues advancing on the NYSE (breadth) made a bullish crossover 25 Aug. – go figure.
-There were 3 Distribution Days this week, but 3 is not enough to send a signal.
-Bollinger Bands, but close to oversold.
-VIX.
-There have been 10 up-days over the last 20 sessions –neutral.
-There have been 8 up-days over the last 10 sessions – neutral.
-Sentiment.
-RSI
-Cyclical Industrials (XLI-ETF) are out-performing the S&P 500, but falling so I’ll call it neutral.
-The 5-10-20 Timer System is HOLD; the 5-dEMA and 10-dEMA are NOT both above the 20-dEMA.
-Slope of the 40-dMA of New-highs is flat. This is one of my favorite trend indicators.
-The short-term, 10-day, Fosback Hi-Low Logic Index.
-The 50-dMA percentage of issues advancing on the NYSE (Breadth) is above 50% ending its streak of consecutive days. (3 days in a row is my “correction-now” signal)
-Cyclical Industrials (XLI-ETF) are out-performing the S&P 500, but falling so I’ll call it neutral.
-There have been 4 Statistically-Significant day (big moves in price-volume) in the last 15-days - neutral.
-The S&P 500 is 5.8% below its 200-dMA. (Bull indicator is 12% below the 200-day, although this is based on “normal” pullbacks.)
-There was an Inverse Zweig Breadth Collapse (negative Breadth Thrust) 21 June. That’s a rare, very-bearish sign, but it was several-weeks ago.
-The 52-week, New-high/new-low ratio improved by 0.7 standard deviations on 15 July – too small to send a signal.
-There was a Hindenburg Omen signal 8 April – it was canceled when the McClellan Oscillator turned bullish.
-The Calm-before-the-Storm/Panic Indicator.
-2.8% of all issues traded on the NYSE made new, 52-week highs when the S&P 500 made a new all-time-high, 3 January. (There is no bullish signal for this indicator.) This indicated that the advance was too narrow and a correction was likely to be >10%. – It proved correct, but is now Expired
-S&P 500 is underperforming the Utilities (XLU), but not by much – call this one neutral.
-The 10-dMA % of issues advancing on the NYSE (Breadth) is below 50%.
-The 100-dMA percentage of issues advancing on the NYSE (Breadth) is below 50%
-26 Aug was a Bearish Outside Reversal Day.
-26 July was a bearish, 90%-down-volume day.
-Issues advancing on the NYSE (Breadth) compared to the S&P 500 were bearish 25 Aug. This stays in effect for 5-days.
-Buying Pressure minus Selling Pressure is falling.
-My Money Trend indicator is falling.
-MACD of S&P 500 price made a bearish crossover 22 Aug.
-Short-term new-high/new-low data.
-McClellan Oscillator is negative.
-The graph of the 100-day Count (the 100-day sum of up-days) is falling.
-The Smart Money (late-day action) is headed down.
-The smoothed advancing volume on the NYSE is falling.
-Only 45% of the 15-ETFs that I track have been up over the last 10-days.
TODAY’S RANKING OF 15 ETFs (Ranked Daily)
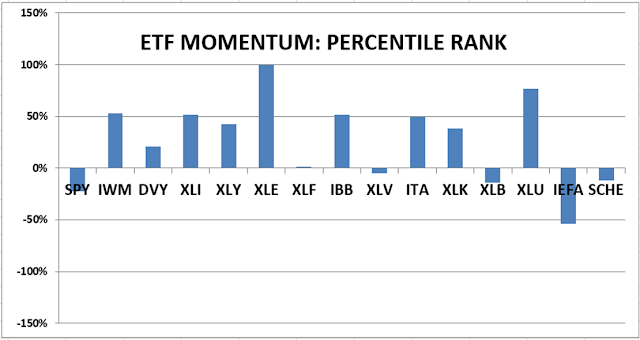
*For additional background on the ETF ranking system see NTSM Page at…
http://navigatethestockmarket.blogspot.com/p/exchange-traded-funds-etf-ranking.html
Here’s the revised DOW 30 and its momentum analysis. The top ranked stock receives 100%. The rest are then ranked based on their momentum relative to the leading stock.

For more details, see NTSM Page at…
https://navigatethestockmarket.blogspot.com/p/a-system-for-trading-dow-30-stocks-my_8.html
