“Trade what you see; not what you think.” – The Old Fool,
Richard McCranie, trader extraordinaire.
SMALL BUSINESS OPTIMISM (Floor Daily)
“NFIB’s Small Business Optimism Index rose 0.4 points in
July to 89.9; however, it is the sixth consecutive month below the 48-year
average of 98. Thirty-seven percent of small business owners reported that
inflation was their single most important problem...” Story at...
https://www.floordaily.net/flooring-news/small-business-optimism-inched-up-to-899-in-july
UNIT LABOR COSTS (FxStreet)
“The data published by the US Bureau of Labor Statistics
showed on Tuesday that Unit Labor Costs rose by 10.8% in the second quarter.
This reading followed the 12.7% increase recorded in the first quarter and
came in higher than the market expectation of 9.5%. Story at...
https://www.fxstreet.com/news/us-unit-labor-costs-rise-108-in-q2-vs-95-expected-202208091235
MARKET REPORT / ANALYSIS
-Tuesday the S&P 500 slipped about 0.4% to 4122.
-VIX rose about 2% to 21.77.
-The yield on the 10-year Treasury rose to 2.785%.
PULLBACK DATA:
-Drop from Top: 14.1% as of today. 23.6% max.
-Trading Days since Top: 150-days.
The S&P 500 is 4.9% Below its 200-dMA & closed 4.5%
Above its 50-dMA. It also closed about slightly above its 100-dMA.
-Resistance points for the rally, are: (1) 4175, the June
highs; (2) 4240, the 50% retracement point (top to bottom); (3) 4342 &
4350, the 200-dMA & upper longer-term trend line, respectively; (4) or
4370, the 62% Fibonacci retracement point for those who believe in that sort of
thing.
*I won’t call the correction over until the S&P 500
makes a new-high; however, we hope to be able to call the bottom when we see
it.
MY TRADING POSITIONS:
SH, short the S&P 500 ETF.
TODAY’S COMMENT:
Still watching the S&P 500 price. The Index drifted down to the 100-dMA at 4114
(now support) at 11 am and bounced up from there. The bulls need to see that
level hold. If it doesn’t, I’ll add more to my short position.
On the high side, I have been watching the June high
levels at 4175 to see if the Index could make a bullish break above that
resistance point. So far, it has not managed to do it.
We saw that the new-52-week-highs outpaced the
new-52-week-lows yesterday, but they flipped back more bearish with new-lows
outpacing new-highs 58 to 26 today.
As noted yesterday, Selling Pressure is now outpacing
Buying Pressure; today the chart of buying-pressure minus selling-pressure is
falling sharply. Still, there are plenty of bullish indicators still in play. I
think watching the price action is more important at this point.
Today, the daily sum of 20 Indicators improved from +11
to +14 (a positive number is bullish; negatives are bearish); the 10-day
smoothed sum that smooths the daily fluctuations improved from +91 to +95. (The
trend direction is more important than the actual number for the 10-day value.)
These numbers sometimes change after I post the blog based on data that comes
in late. Most of these 20 indicators are short-term so they tend to bounce
around a lot. With a more bullish 10-dMA, the call is muddied regarding
whether the Index made a top on 9 August.
LONG-TERM INDICATOR: The Long
Term NTSM indicator remained BUY: VIX, PRICE & VOLUME are bullish;
SENTIMENT is neutral. I still expect the S&P 500 to test its prior low of
3667. Remember for the longer-term, one indicator trumps them all – “Don’t
fight the FED.”
I’m a Bear longer-term; short-term, the bulls were back
control of the markets, but that is in question now. For me, it’s all about
4175 (June highs) and the 100-dMA (4114). Can the Index break above 4175 or
will it fall convincingly below 4114?
The markets may be one piece of bad news from a market
rout. I don’t know what that news may be, but it wouldn’t take much to kill the
rally. CPI is out tomorrow.
BEST ETFs - MOMENTUM ANALYSIS:
TODAY’S RANKING OF 15 ETFs
(Ranked Daily)
*For additional background on
the ETF ranking system see NTSM Page at…
http://navigatethestockmarket.blogspot.com/p/exchange-traded-funds-etf-ranking.html
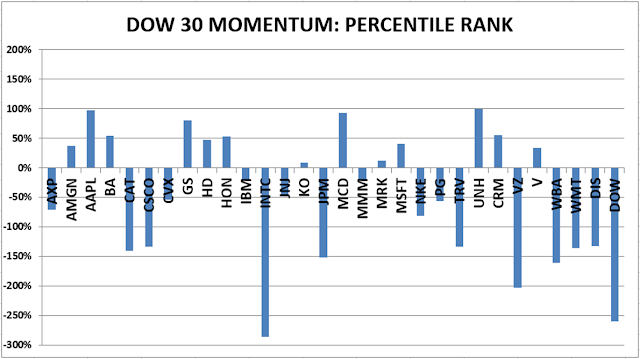
BEST DOW STOCKS - TODAY’S MOMENTUM
RANKING OF THE DOW 30 STOCKS (Ranked Daily)
Here’s the revised DOW 30 and
its momentum analysis. The top ranked stock receives 100%. The rest are then
ranked based on their momentum relative to the leading stock.
For more details, see NTSM
Page at…
https://navigatethestockmarket.blogspot.com/p/a-system-for-trading-dow-30-stocks-my_8.html
TUESDAY MARKET INTERNALS (NYSE
DATA)
My basket of Market Internals remained BUY.
(Market Internals are a decent trend-following
analysis of current market action, but should not be used alone for short term
trading. They are most useful when they diverge from the Index.)
My stock-allocation in the
portfolio is now roughly 30% invested in stocks.
I trade about 15-20% of the
total portfolio using the momentum-based analysis I provide here. If I can see
a definitive bottom, I’ll add a lot more stocks to the portfolio using an
S&P 500 ETF.