Durable Orders ... Crude Oil Inventories ... Momentum Trading DOW Stocks & ETFs … Stock Market Analysis ...
“Trade what you see; not what you think.” – The Old Fool,
Richard McCranie, trader extraordinaire.
“I cannot agree to vote for a full increase in the debt
without any assurance that steps will be taken early next year to reduce the
alarming increase in the deficits and the debt.” - Sen. Joe Biden, October
1984. Biden now opposes exactly what he supported in 1984.
Politicians...don’t you just love em?
DURABLE ORDERS (SME Manufacturing Tech Series)
“Orders for durable goods increased in March after a
surge in orders for aircraft, the Commerce Department said today. Durable goods orders rose 3.2% to
$276.4 billion, the department said in a monthly report. That snapped a streak
of two monthly declines, including a fall of 1.2% in February. Excluding
transportation, orders advanced 0.3%.
CRUDE OIL INVENTORIES (EIA)
“U.S. commercial crude oil inventories (excluding those
in the Strategic Petroleum Reserve) decreased by 5.1 million barrels from the
previous week. At 460.9 million barrels, U.S. crude oil inventories are about
1% below the five-year average for this time of year.” Report at...
https://ir.eia.gov/wpsr/wpsrsummary.pdf
MARKET REPORT / ANALYSIS
-Wednesday the S&P 500 fell about 0.4% to 4056.
-VIX rose about 0.4% to 18.84. (Options traders don’t
seem worried.)
-The yield on the 10-year Treasury rose to 3.450%.
PULLBACK DATA:
-Drop from Top: 15.4% as of today. 25.4% max (on a
closing basis).
-Trading Days since Top: 328-days.
The S&P 500 is 2.4% ABOVE its 200-dMA and 0.6%
ABOVE its 50-dMA.
*I won’t call the correction over until the S&P 500
makes a new-high; however, evidence suggests the bottom was in the 3600 area.
MY TRADING POSITIONS:
I am not trading as much as in the past. You may wish to
use the momentum charts and/or the Monday 40-day gain charts for trading the
Dow stocks and ETFs.
XLK – Technology ETF.
XLE – Energy Sector ETF. It hasn’t been doing much
recently, but Russia is cutting production and that should help the
sector. We have a good dividend in the
meantime.
BA – Boeing reported 4/26/2023 and gave good guidance
going forward. BA was up nearly 5% on
the news, but faded along with the markets on renewed bank fears.
XLY - Consumer Discretionary ETF.
KRE – Regional Banking ETF. This is a small position for
me.
SHY – Short term bonds. 30-day yield is 4%. (Trailing
1-year yield is 1.6%.) I’ll hold this, but if the market retests the lows, I’ll
sell it and buy stocks.)
TODAY’S COMMENT:
Repeating from yesterday: Today, there is still a Bollinger Squeeze. Investopedia
says, “When Bollinger Bands® are far apart, volatility is high. When they are
close together, it is low. A Squeeze is triggered when volatility reaches a
six-month low and is identified when Bollinger Bands® reach a six-month minimum
distance apart.”
https://www.investopedia.com/terms/r/rsi.asp
A squeeze precedes a big breakout either up or down. Bollinger
said to use RSI and a couple of other indicators I don’t follow to determine
the direction of the breakout. RSI is 43 and is closer to oversold than
overbought. Bollinger Bands are also close to “oversold” so it looks like the
break out should be up.
S&P 500 is less than 1% above its 50-dMA. Since I am
still bullish, I expect the 50-dMA to hold.
If the S&P 500 drops lower, I may have to reconsider.
Breadth continues to deteriorate. Both the 10dMA and the
50dMA of the % of issues advancing on the NYSE are below 50%. The 100-day and
150-day are also close to the 50% mark. Falling breadth is a worrisome issue for
investors.
The Friday summary of indicators will be
interesting. For now, the long-term
indicator ensemble is closer to Buy than Sell, so I am not taking any action
yet. I did sell leveraged positions (2x
ETFs) when this recent weakness started.
Today, the daily spread of 20 Indicators (Bulls minus
Bears) improved from -9 to -8 (a positive number is bullish; negatives
are bearish); the 10-day smoothed sum that smooths the daily fluctuations declined
from -11 to -23. (The trend direction is more important than the actual number
for the 10-day value.) These numbers sometimes change after I post the blog
based on data that comes in late. Most of these 20 indicators are short-term so
they tend to bounce around a lot.
LONG-TERM INDICATOR: The Long Term NTSM indicator remained
HOLD: PRICE is positive; SENTIMENT, VIX & VOLUME are neutral.
(The important BUY in this indicator was on 21 October,
7-days after the bottom. For my NTSM overall signal, I suggested that a
short-term buying opportunity occurred on 27 September (based on improved
market internals on the retest), although without market follow-thru, I was
unwilling to call a buy; however, I did close shorts and increased stock
holdings. I issued a Buy-Signal on 4 October, 6-days before the final bottom,
based on stronger market action that confirmed the market internals signal. The
NTSM sell-signal was issued 20 December, 8 sessions before the high of this
recent bear market, based on the bearish “Friday Rundown” of indicators.)
Bottom line: I am a cautious Bull, watching indicators as
always.
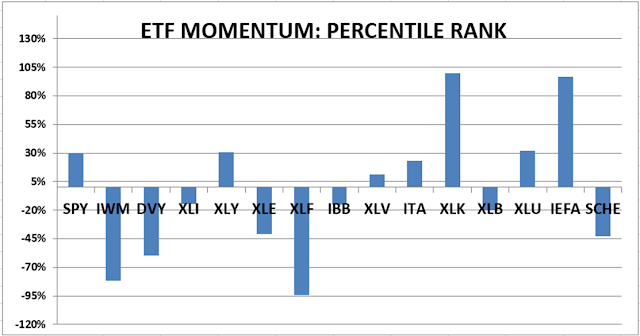
ETF - MOMENTUM ANALYSIS:
TODAY’S RANKING OF 15 ETFs
(Ranked Daily)
ETF ranking follows:
The top ranked ETF receives
100%. The rest are then ranked based on their momentum relative to the leading
ETF.
*For additional background on
the ETF ranking system see NTSM Page at…
http://navigatethestockmarket.blogspot.com/p/exchange-traded-funds-etf-ranking.html
DOW STOCKS - TODAY’S MOMENTUM RANKING
OF THE DOW 30 STOCKS (Ranked Daily)
DOW 30 momentum ranking
follows:
The top ranked Stock receives
100%. The rest are then ranked based on their momentum relative to the leading Stock.
For more details, see NTSM
Page at…
https://navigatethestockmarket.blogspot.com/p/a-system-for-trading-dow-30-stocks-my_8.html
WEDNESDAY MARKET INTERNALS
(NYSE DATA)
My basket of Market Internals remained SELL. (Market Internals are a
decent trend-following analysis of current market action, but should not be
used alone for short term trading. They are most useful when they diverge from
the Index.)
...My current invested
position is about 65% stocks, including stock mutual funds and ETFs. I’m
usually about 50% invested in stocks.
I trade about 15-20% of the
total portfolio using the momentum-based analysis I provide here. If I can see
a definitive bottom, I’ll add a lot more stocks to the portfolio using an
S&P 500 ETF.