ISM Manufacturing ... Construction Spending ... Momentum Trading DOW Stocks & ETFs … Stock Market Analysis ...
“Trade what you see; not what you think.” – The Old Fool,
Richard McCranie, trader extraordinaire.
“Delaware Superior Court Judge Eric J. Davis concluded
the right-wing media organization [Fox News] made false statements about the
election technology company related to the 2020 presidential contest. Davis
said the case would go to a jury trial, scheduled for April 17. ‘The evidence
developed in this civil proceeding demonstrates that is CRYSTAL clear that none
of the Statements relating to Dominion about the 2020 election are true.’” –
Business Insider.
“Last Sunday’s “Berlin Climate Neutrality By 2030”
referendum failed resoundingly despite the more than a million euros spent in a
massive run-up campaign that included plastering the city with posters,
concerts by famous performers, huge support and propaganda by the media and
hefty donations coming from left wing activists from the east and west coasts
of USA...Only 442,210 cast a vote in favor, which represents only 18% of
Berlin’s eligible voters. The activists expected a far greater turnout. 82%
refused to lend any support.” - Pierre L.Gosslin. Commentary at...
https://notrickszone.com/2023/03/28/body-blow-to-activists-whopping-82-of-berlins-voters-refused-to-support-2030-climate-neutrality/
ISM MANUFACTURING (ISM via prnewswire)
"The March Manufacturing PMI® registered
46.3 percent, 1.4 percentage points lower than the 47.7 percent recorded in
February. Regarding the overall economy, this figure indicates a fourth month
of contraction after a 30-month period of expansion. The Manufacturing PMI® is
at its lowest level since May 2020, when it
registered 43.5 percent.” Press release at...
https://www.prnewswire.com/news-releases/manufacturing-pmi-at-46-3-march-2023-manufacturing-ism-report-on-business-301787309.html
CONSTRUCTION SPENDING (YahooFinance)
“U.S. construction spending dipped in February as investment
in single-family homebuilding maintained its downward trend amid higher
mortgage costs. The Commerce Department said on Monday that construction
spending slipped 0.1% in February after increasing 0.4% in January.” Story
at...
https://finance.yahoo.com/news/us-construction-spending-slips-february-143000626.html
MARKET REPORT / ANALYSIS
-Monday the S&P 500 rose about 0.4% to 4124.
-VIX slipped about 0.8% to 18.55.
-The yield on the 10-year Treasury slipped to 3.421%.
PULLBACK DATA:
-Drop from Top: 14% as of today. 25.4% max (on a closing
basis).
-Trading Days since Top: 313-days.
The S&P 500 is 4.8% ABOVE its 200-dMA and 2.5%
ABOVE its 50-dMA.
*I won’t call the correction over until the S&P 500
makes a new-high; however, evidence suggests the bottom was in the 3600 area.
MY TRADING POSITIONS:
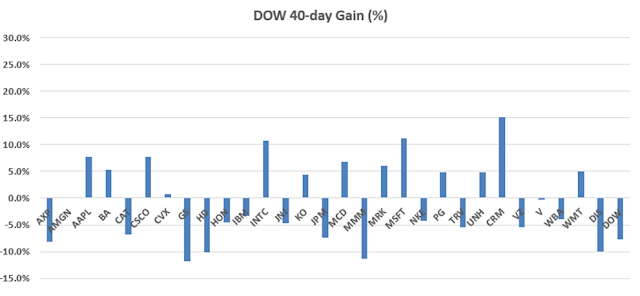
I am not trading as much as in the past. You may wish to
use the momentum charts and/or the Monday 40-day gain charts for trading the
Dow stocks and ETFs.
QLD – 2xNasdaq 100
SSO – 2x S&P 500
XLK – Technology ETF.
XLE – Energy Sector ETF. It hasn’t been doing much
recently, but Russia is cutting production and that should help the
sector. We have a good dividend in the
meantime.
BA – (Boeing) I am late on this one, but we’ll see. They
have more work than they can handle and are hiring. They should do well going
forward. Boeing reports earnings 4/26/2023.
XLY - Consumer Discretionary ETF.
KRE – Regional Banking ETF. This is a small position for
me. I have no cash left.
SHY – Short term bonds. 30-day yield is 4.6%. (Trailing
1-year yield is 1.3%.) I’ll hold this, but if the market retests the lows, I’ll
sell it and buy stocks.)
TODAY’S COMMENT:
Bollinger Bands are overbought again today and there have
been 8 up-days in the last 10-days. That suggests some weakness, but I don’t
see any other top indicators so I doubt that we’re looking at a real pullback.
Markets don’t go up in a straight line so a down-day or two is overdue.
Today, the daily spread of 20 Indicators (Bulls minus
Bears) slipped from +7 to +5 (a positive number is bullish; negatives are
bearish); the 10-day smoothed sum that smooths the daily fluctuations improved
from +21 to +31. (The trend direction is more important than the actual number
for the 10-day value.) These numbers sometimes change after I post the blog
based on data that comes in late. Most of these 20 indicators are short-term so
they tend to bounce around a lot.
LONG-TERM INDICATOR: The Long Term NTSM indicator was
BUY: VOLUME is positive; SENTIMENT, VIX & PRICE are neutral. The Breadth
Thrust Friday pushes this indicator to BUY.
(The important BUY in this indicator was on 21 October,
7-days after the bottom. For my NTSM overall signal, I suggested that a
short-term buying opportunity occurred on 27 September (based on improved
market internals on the retest), although without market follow-thru, I was
unwilling to call a buy; however, I did close shorts and increased stock
holdings. I issued a Buy-Signal on 4 October, 6-days before the final bottom,
based on stronger market action that confirmed the market internals signal. The
NTSM sell-signal was issued 20 December, 8 sessions before the high of this
recent bear market, based on the bearish “Friday Rundown” of indicators.)
Bottom line: I am a Bull. We’ve seen some very bullish
signs recently, confirmed by the Friday Rundown of Indicators.
ETF - MOMENTUM ANALYSIS:
TODAY’S RANKING OF 15 ETFs
(Ranked Daily)
ETF ranking follows:
The top ranked ETF receives
100%. The rest are then ranked based on their momentum relative to the leading
ETF.
*For additional background on
the ETF ranking system see NTSM Page at…
http://navigatethestockmarket.blogspot.com/p/exchange-traded-funds-etf-ranking.html
DOW STOCKS - TODAY’S MOMENTUM RANKING
OF THE DOW 30 STOCKS (Ranked Daily)
DOW 30 momentum ranking
follows:

The top ranked Stock receives
100%. The rest are then ranked based on their momentum relative to the leading Stock.
For more details, see NTSM
Page at…
https://navigatethestockmarket.blogspot.com/p/a-system-for-trading-dow-30-stocks-my_8.html
MONDAY MARKET INTERNALS (NYSE
DATA)
My basket of Market Internals slipped to HOLD. (Market Internals are a
decent trend-following analysis of current market action, but should not be
used alone for short term trading. They are most useful when they diverge from
the Index.)
...My current invested
position is about 75% stocks, including stock mutual funds and ETFs. I’m
usually about 50% invested in stocks.
I trade about 15-20% of the
total portfolio using the momentum-based analysis I provide here. If I can see
a definitive bottom, I’ll add a lot more stocks to the portfolio using an
S&P 500 ETF.