“Gold has been the quiet bull market story all year. In interviews and here I have speculated that China has been the primary driver and strong bid beneath the market as they prepare for war, economic or military. When a country knows war is coming, they sell assets in the currency of their enemy. There is also fuel from the perception that the Fed is going to cut interest rates faster than any other major central bank which puts the U.S. dollar in harm’s way.” – Paul Schatz, President Heritage Capital. Blog at...
https://investfortomorrow.com/blog/weakest-week-of-the-year-phooey/
Now in September 2024, the number of Nasdaq traded issues is down 16% from the 2022 high. And thus far, the major averages are not showing any sign of any liquidity problems. Neither are the breadth statistics, with the NYSE A-D Line at a new all-time high. I believe that the drying up of all the Covid money is going to matter at some point. I cannot demonstrate that we are at that point just yet. But we are on the way.” - Tom McClellan
Editor, The McClellan Market Report
“The September Chicago PMI edged up, but stayed in contraction territory. PMI rose to 46.6 compared to the forecasted 46.1 level.” Story at...
https://www.msn.com/en-us/money/markets/stock-index-futures-tick-down-ahead-of-chicago-pmi/ar-AA1rsBpP?ocid=finance-verthp-feeds
-Monday the S&P 500 rose about 0.4% to 5762.
-VIX declined about 1% to 16.73.
-The yield on the 10-year Treasury rose to 3.787% (compared to about this time, prior trading day).
XLK – Holding since the October 2022 lows. Added more 9/20.
UWM – added 7/15 & more 9/20.
QLD – added 7/24.
SSO – added 9/16.
SPY – added 9/19 & more 9/20
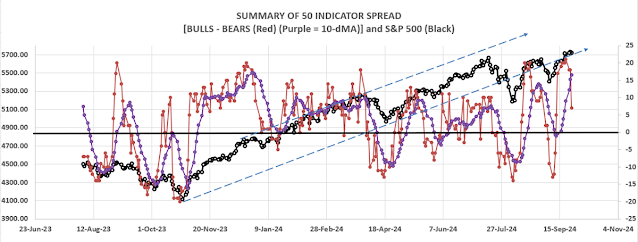
The Bull/Bear Spread remained in a BULL position at 6 Bear-sign and 15-Bull. (The rest are neutral. It is normal to have a lot of neutral indicators since many of those are top or bottom indicators that will signal only at extremes.)

The Bull/Bear, 50-Indicator spread (Bull Indicators minus Bear Indicators) declined to +9 (9 more Bull indicators than Bear indicators). The 10-dMA is sloping upward, remaining bullish.
It was nice to see the S&P 500 finish higher Monday. I was beginning to get concerned that the Index hadn’t made much advance in the last 2 weeks and, to reflect that concern, I added a rising wedge pattern to the chart in red. This is a bearish pattern since it is showing that the Index is struggling to move higher. That pattern will be overcome if the Index does continue up. (Fair warning: I am not a great chartist.)
I remain bullish.
TODAY’S RANKING OF 15 ETFs (Ranked Daily) ETF ranking follows:

*For additional background on the ETF ranking system see NTSM Page at…
http://navigatethestockmarket.blogspot.com/p/exchange-traded-funds-etf-ranking.html

DOW STOCKS - TODAY’S MOMENTUM RANKING OF THE DOW 30 STOCKS (Ranked Daily)

For more details, see NTSM Page at…
https://navigatethestockmarket.blogspot.com/p/a-system-for-trading-dow-30-stocks-my_8.html

MONDAY MARKET INTERNALS (NYSE DATA)