Existing Home Sales ... Momentum Trading DOW Stocks & ETFs … Stock Market Analysis ...
“Trade what you see; not what you think.” – The Old Fool,
Richard McCranie, trader extraordinaire.
“This [Trump prosecution in NY] is the worst example in
my 60 years of practicing criminal law, of targeting somebody for prosecution
and then rummaging through the books, giving people immunity and trying to
concoct a crime that doesn’t exist. And if this is allowed to succeed, none of
our liberties is safe...You know, today it’s a Republican who’s a target.
Tomorrow it’s a Democrat, and the day after tomorrow, it’s your Uncle Charlie,
or your nephew, or your niece...they had to staple together two unrelated
statutes, one federal, one state, violate the statute of limitations, violate
the rule of law, and concoct a crime.” - Alan Dershowitz, American lawyer and
former Harvard law professor. Commentary at...
Alan
Dershowitz on Trump Indictment: Violation of ‘Bible’ (mediaite.com)
EXISTING HOME SALES (YahooFinance)
“Existing home sales in February jumped 14.5% to an
annualized rate of 4.58 million, the largest monthly percentage increase since
July 2020 and ending a 12-month slide, data from the National Association of Realtors out Tuesday showed.”
Story at...
https://finance.yahoo.com/news/existing-home-sales-jump-in-february-as-mortgage-rates-fall-140027320.html
MARKET REPORT / ANALYSIS
-Tuesday the S&P 500 rose about 1.3% to 4003.
-VIX fell about 11% to 21.38.
-The yield on the 10-year Treasury rose to 3.609%.
PULLBACK DATA:
-Drop from Top: 16.5% as of today. 25.4% max (on a
closing basis).
-Trading Days since Top: 303-days.
The S&P 500 is 1.7% ABOVE its 200-dMA & 0.2%
BELOW its 50-dMA.
*I won’t call the correction over until the S&P 500
makes a new-high; however, evidence suggests the bottom was in the 3600 area.
MY TRADING POSITIONS:
I am not trading as much as in the past. You may wish to
use the momentum charts and/or the Monday 40-day gain charts for trading the
Dow stocks and ETFs.
QLD – 2xNasdaq 100
SSO – 2x S&P 500
XLK – Technology ETF.
XLE – Energy Sector ETF. It hasn’t been doing much
recently, but Russia is cutting production and that should help the
sector. We have a good dividend in the
meantime.
BA – (Boeing) I am late on this one, but we’ll see. They
have more work than they can handle and are hiring. They should do well going
forward.
XLY - Consumer Discretionary ETF.
*KRE – Regional Banking ETF. Added Monday. This is a
small position for me. I have no cash
left.
SHY – Short term bonds. 30-day yield is 4.6%. (Trailing
1-year yield is 1.3%.) I’ll hold this, but if the market retests the lows, I’ll
sell it and buy stocks.)
If it’s not tech, it’s probably not working.
TODAY’S COMMENT:
Sentiment reached very low (bearish) levels yesterday. I
measure Sentiment as %-Bulls (Bulls/{bulls+bears}) based on the amounts
invested in Rydex/Guggenheim mutual funds on a 5-day moving average. I track
this using a standard deviation basis and it is now issuing a bull sign. There
are others, too.
MACD of S&P 500 price switched to a bull signal; the
5-day EMA is above the 10-day EMA so short-term momentum has turned bullish;
Smart Money is buying and the smoothed advancing volume on the NYSE is rising,
to name a few.
It’s interesting to hear the Fast Money pundits on CNBC
all saying that the market is mispricing risk because of a coming recession. (Curiously, some of them are long while they
are talking down the market. What’s that
about?) The
Market doesn’t misprice anything. The
Market consists of a mass of investors who are voting with their money. Right now, they are voting that a recession
may be farther away than the experts think.
Trade what you see; not what you think.
Today, the daily spread of 20 Indicators (Bulls minus
Bears) improved from -5 to -1 (a positive number is bullish; negatives are
bearish); the 10-day smoothed sum that smooths the daily fluctuations declined
from -41 to -43. (The trend direction is more important than the actual number
for the 10-day value.) These numbers sometimes change after I post the blog
based on data that comes in late. Most of these 20 indicators are short-term so
they tend to bounce around a lot.
LONG-TERM INDICATOR: The Long Term NTSM indicator was HOLD:
VIX, VOLUME & PRICE are negative; SENTIMENT is bullish.
(The important BUY in this indicator was on 21 October,
7-days after the bottom. For my NTSM overall signal, I suggested that a
short-term buying opportunity occurred on 27 September (based on improved
market internals on the retest), although without market follow-thru, I was
unwilling to call a buy; however, I did close shorts and increased stock
holdings. I issued a Buy-Signal on 4 October, 6-days before the final bottom,
based on stronger market action that confirmed the market internals signal. The
NTSM sell-signal was issued 20 December, 8 sessions before the high of this
recent bear market, based on the bearish Friday rundown of indicators.)
Bottom line: I am a nervous bull, but we saw good price-action
again today. The S&P 500 remained above its 200-dMA; let’s see if it can break
above the 50-dMA and remain there.
ETF - MOMENTUM ANALYSIS:
TODAY’S RANKING OF 15 ETFs
(Ranked Daily)
ETF ranking follows:
The top ranked ETF receives
100%. The rest are then ranked based on their momentum relative to the leading
ETF.
*For additional background on
the ETF ranking system see NTSM Page at…
http://navigatethestockmarket.blogspot.com/p/exchange-traded-funds-etf-ranking.html
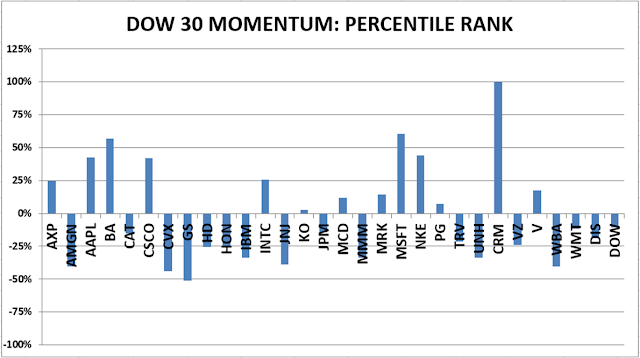
DOW STOCKS - TODAY’S MOMENTUM RANKING
OF THE DOW 30 STOCKS (Ranked Daily)
DOW 30 momentum ranking
follows:
The top ranked Stock receives
100%. The rest are then ranked based on their momentum relative to the leading Stock.
For more details, see NTSM
Page at…
https://navigatethestockmarket.blogspot.com/p/a-system-for-trading-dow-30-stocks-my_8.html
TUESDAY MARKET INTERNALS (NYSE
DATA)
My basket of Market Internals remained HOLD. (Market Internals are a
decent trend-following analysis of current market action, but should not be
used alone for short term trading. They are most useful when they diverge from
the Index.)
...My current invested
position is about 75% stocks, including stock mutual funds and ETFs. I’m
usually about 50% invested in stocks.
I trade about 15-20% of the
total portfolio using the momentum-based analysis I provide here. If I can see
a definitive bottom, I’ll add a lot more stocks to the portfolio using an
S&P 500 ETF.