“Trade what you see; not what you think.” – The Old Fool,
Richard McCranie, trader extraordinaire.
FED MEMBERS CALL FOR HIGHER RATES (YahooFinance)
“Two Federal Reserve officials speaking Wednesday said more aggressive interest rate hikes are likely necessary to slow inflation, as is the central bank keeping rates at elevated levels for some time. Minneapolis Fed President Neel Kashkari said Wednesday he is remaining "open-minded" about whether the Fed should raise rates by 25 or 50 basis points at its next policy meeting on March 21-22. Elsewhere, Atlanta Fed President Raphael Bostic said Wednesday he believes the Fed needs to raise its policy rate by 50 basis points, to a range of 5%-5.25%, and hold it at that level until well into 2024.” Story at...
https://finance.yahoo.com/news/feds-bostic-kashkari-call-for-higher-rates-after-concerning-inflation-jobs-data-150224928.html
ISM MANUFACTURING (ISM vis prNewswire)
"The February Manufacturing PMI® registered 47.7 percent, 0.3 percentage point higher than the 47.4 percent recorded in January. Regarding the overall economy, this figure indicates a third month of contraction after a 30-month period of expansion. In the last two months, the Manufacturing PMI® has been at its lowest levels since May 2020... The New Orders Index remained in contraction territory at 47 percent, 4.5 percentage points higher than the figure of 42.5 percent recorded in January...The Backlog of Orders Index registered 45.1 percent, 1.7 percentage points higher than the January reading of 43.4 percent.”
https://www.prnewswire.com/news-releases/manufacturing-pmi-at-47-7-february-2023-manufacturing-ism-report-on-business-301758406.html
Basically, manufacturing is slowing, but not as fast as last month.
CONSTRUCTION SPENDING (Trading Economics)
“Construction spending in the United States went down by 0.1% month-over-month to $1.826 trillion in January of 2023, following an upwardly revised 0.7% contraction in the previous month and missing market forecasts of a 0.2% growth.” Story at...
https://tradingeconomics.com/united-states/construction-spending
EIA CRUDE INVENTORIES (EIA)
“U.S. commercial crude oil inventories (excluding those in the Strategic Petroleum Reserve) increased by 1.2 million barrels from the previous week. At 480.2 million barrels, U.S. crude oil inventories are about 9% above the five year average for this time of year.” Report at...
https://ir.eia.gov/wpsr/wpsrsummary.pdf
STOCK MARKET SIGNALS THE BEAR MARKET IS OVER (msn.com)
“The S&P 500...[signaled]...that the bear market decline in stocks that began last year is finally over, according to an obscure technical signal. That signal is the S&P 500 notching two consecutive monthly closes above its 10-month moving average after a 20% market decline. As long as the S&P 500 ends February above the 3,947 level, the signal will have been triggered, according to Urban Carmel, an investment strategy analyst at The Fat Pitch.” Story at...
The stock market is on the verge of signaling that the bear market is finally over (msn.com)
MARKET REPORT / ANALYSIS
-Wednesday the S&P 500 dropped about 0.5% to 3951.
-VIX dipped about 1% to 20.58. (The Options crowd doesn’t seem worried.)
-The yield on the 10-year Treasury was little changed at 4.009%.
PULLBACK DATA:
-Drop from Top: 17.6% as of today. 25.4% max (on a closing basis).
-Trading Days since Top: 290-days.
The S&P 500 is 0.3% ABOVE its 200-dMA & 0.8% BELOW its 50-dMA.
*I won’t call the correction over until the S&P 500 makes a new-high; however, evidence suggests the bottom was in the 3600 area.
MY TRADING POSITIONS:
QLD – 2xNasdaq 100
SSO – 2x S&P 500
XLK – Technology ETF.
XLE – Energy Sector ETF. It hasn’t been doing much recently, but Russia is cutting production and that should help the sector. We have a good dividend in the meantime.
BA – (Boeing) I am late on this one, but we’ll see.
XLY - Consumer Discretionary ETF.
SHY – Short term bonds. 30-day yield is 4.2%. (Trailing
1-year yield is 1.3%.) I’ll hold this, but if the market retests the lows, I’ll
sell it and buy stocks.)
TODAY’S COMMENT:
Today, (Wednesday) unchanged volume was again very high. As I’ve often said, many believe that this indicator suggests investor confusion at market turning points. Recently, when we saw this indicator near the lower trend line, (as it is now) the S&P 500 bounced higher. It does look bullish. I am suspicious that, now, the unchanged volume may suggest that weak hands are selling to the Smart Money.
Everyone and his brother and sister have been calling for
stock market declines in advance of the coming recession. I have been
skeptical, but the churning we have seen recently is worrisome if one listens
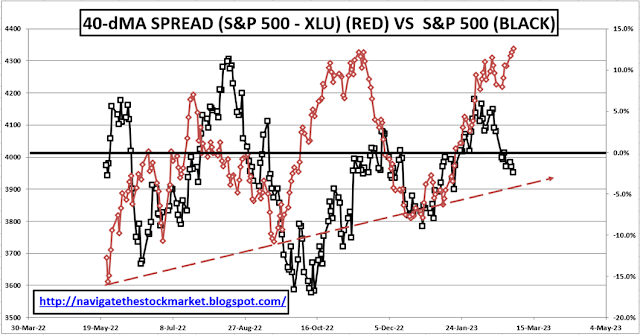
to financial TV. Still, I don’t see a recession, or even a correction in the
stock market anytime soon, as long as Utilities (XLU) are underperforming the
S&P 500. The rising red line indicates extreme under-performance by the XLU
vs. S&P 500 and is a bullish sign.
I am shocked that no Pundits are talking about one of the
classic “correction over” signs. The 200-dMA is sloping up now, not by much,
but up none-the-less.
The important thing to remember - things can always
change.
I remain bullish and heavily invested in stocks. We’re
due for a change in direction soon, i.e., I think markets will turn up.
Today, the daily spread of 20 Indicators (Bulls minus
Bears) declined from +1 to -1 (a positive number is bullish; negatives are
bearish); the 10-day smoothed sum that smooths the daily fluctuations declined
from +5 to +2. (The trend direction is more important than the actual number for
the 10-day value.) These numbers sometimes change after I post the blog based
on data that comes in late. Most of these 20 indicators are short-term so they
tend to bounce around a lot.
LONG-TERM INDICATOR: The Long Term NTSM indicator
remained HOLD: PRICE is positive; VIX & SENTIMENT are neutral. VOLUME was negative.
(The important BUY in this indicator was on 21 October,
7-days after the bottom. For my NTSM overall signal, I suggested that a
short-term buying opportunity occurred on 27 September (based on improved
market internals on the retest), although without market follow-thru, I was
unwilling to call a buy; however, I did close shorts and increased stock
holdings. I issued a Buy-Signal on 4 October, 6-days before the final bottom,
based on stronger market action that confirmed the market internals signal. The
NTSM sell-signal was issued 20 December, 8 sessions before the high of this
recent bear market, based on the bearish Friday rundown of indicators.)
Bottom line: I remain a BULL, although somewhat more
cautious.
ETF - MOMENTUM ANALYSIS:
TODAY’S RANKING OF 15 ETFs (Ranked Daily)
ETF ranking follows:

The top ranked ETF receives 100%. The rest are then ranked based on their momentum relative to the leading ETF.
*For additional background on the ETF ranking system see NTSM Page at…
http://navigatethestockmarket.blogspot.com/p/exchange-traded-funds-etf-ranking.html
DOW STOCKS - TODAY’S MOMENTUM RANKING
OF THE DOW 30 STOCKS (Ranked Daily)
DOW 30 momentum ranking follows:

The top ranked Stock receives 100%. The rest are then ranked based on their momentum relative to the leading Stock.
For more details, see NTSM Page at…
https://navigatethestockmarket.blogspot.com/p/a-system-for-trading-dow-30-stocks-my_8.html
WEDNESDAY MARKET INTERNALS
(NYSE DATA)
 My basket of Market Internals remained SELL. (Market Internals are a
decent trend-following analysis of current market action, but should not be
used alone for short term trading. They are most useful when they diverge from
the Index.)
My basket of Market Internals remained SELL. (Market Internals are a
decent trend-following analysis of current market action, but should not be
used alone for short term trading. They are most useful when they diverge from
the Index.)

...My current invested position
is about 75% stocks, including stock mutual funds and ETFs. I’m usually about
50% invested in stocks.
I trade about 15-20% of the
total portfolio using the momentum-based analysis I provide here. If I can see
a definitive bottom, I’ll add a lot more stocks to the portfolio using an
S&P 500 ETF.
“Two Federal Reserve officials speaking Wednesday said more aggressive interest rate hikes are likely necessary to slow inflation, as is the central bank keeping rates at elevated levels for some time. Minneapolis Fed President Neel Kashkari said Wednesday he is remaining "open-minded" about whether the Fed should raise rates by 25 or 50 basis points at its next policy meeting on March 21-22. Elsewhere, Atlanta Fed President Raphael Bostic said Wednesday he believes the Fed needs to raise its policy rate by 50 basis points, to a range of 5%-5.25%, and hold it at that level until well into 2024.” Story at...
https://finance.yahoo.com/news/feds-bostic-kashkari-call-for-higher-rates-after-concerning-inflation-jobs-data-150224928.html
"The February Manufacturing PMI® registered 47.7 percent, 0.3 percentage point higher than the 47.4 percent recorded in January. Regarding the overall economy, this figure indicates a third month of contraction after a 30-month period of expansion. In the last two months, the Manufacturing PMI® has been at its lowest levels since May 2020... The New Orders Index remained in contraction territory at 47 percent, 4.5 percentage points higher than the figure of 42.5 percent recorded in January...The Backlog of Orders Index registered 45.1 percent, 1.7 percentage points higher than the January reading of 43.4 percent.”
https://www.prnewswire.com/news-releases/manufacturing-pmi-at-47-7-february-2023-manufacturing-ism-report-on-business-301758406.html
Basically, manufacturing is slowing, but not as fast as last month.
“Construction spending in the United States went down by 0.1% month-over-month to $1.826 trillion in January of 2023, following an upwardly revised 0.7% contraction in the previous month and missing market forecasts of a 0.2% growth.” Story at...
https://tradingeconomics.com/united-states/construction-spending
“U.S. commercial crude oil inventories (excluding those in the Strategic Petroleum Reserve) increased by 1.2 million barrels from the previous week. At 480.2 million barrels, U.S. crude oil inventories are about 9% above the five year average for this time of year.” Report at...
https://ir.eia.gov/wpsr/wpsrsummary.pdf
“The S&P 500...[signaled]...that the bear market decline in stocks that began last year is finally over, according to an obscure technical signal. That signal is the S&P 500 notching two consecutive monthly closes above its 10-month moving average after a 20% market decline. As long as the S&P 500 ends February above the 3,947 level, the signal will have been triggered, according to Urban Carmel, an investment strategy analyst at The Fat Pitch.” Story at...
The stock market is on the verge of signaling that the bear market is finally over (msn.com)
-Wednesday the S&P 500 dropped about 0.5% to 3951.
-VIX dipped about 1% to 20.58. (The Options crowd doesn’t seem worried.)
-The yield on the 10-year Treasury was little changed at 4.009%.
-Drop from Top: 17.6% as of today. 25.4% max (on a closing basis).
-Trading Days since Top: 290-days.
The S&P 500 is 0.3% ABOVE its 200-dMA & 0.8% BELOW its 50-dMA.
*I won’t call the correction over until the S&P 500 makes a new-high; however, evidence suggests the bottom was in the 3600 area.
QLD – 2xNasdaq 100
SSO – 2x S&P 500
XLK – Technology ETF.
XLE – Energy Sector ETF. It hasn’t been doing much recently, but Russia is cutting production and that should help the sector. We have a good dividend in the meantime.
BA – (Boeing) I am late on this one, but we’ll see.
XLY - Consumer Discretionary ETF.
Today, (Wednesday) unchanged volume was again very high. As I’ve often said, many believe that this indicator suggests investor confusion at market turning points. Recently, when we saw this indicator near the lower trend line, (as it is now) the S&P 500 bounced higher. It does look bullish. I am suspicious that, now, the unchanged volume may suggest that weak hands are selling to the Smart Money.
ETF - MOMENTUM ANALYSIS:
TODAY’S RANKING OF 15 ETFs (Ranked Daily)
ETF ranking follows:
The top ranked ETF receives 100%. The rest are then ranked based on their momentum relative to the leading ETF.
*For additional background on the ETF ranking system see NTSM Page at…
http://navigatethestockmarket.blogspot.com/p/exchange-traded-funds-etf-ranking.html
DOW 30 momentum ranking follows:
The top ranked Stock receives 100%. The rest are then ranked based on their momentum relative to the leading Stock.
For more details, see NTSM Page at…
https://navigatethestockmarket.blogspot.com/p/a-system-for-trading-dow-30-stocks-my_8.html