“Trade what you see; not what you think.” – The Old Fool,
Richard McCranie, trader extraordinaire.
EMPIRE STATE MANUFACTURING (NY Federal Reserve)
“Business activity continued to decline in New York State, according to firms responding to the March 2023 Empire State Manufacturing Survey. The headline general business conditions index fell nineteen points to -24.6. New orders dropped significantly, and shipments declined modestly... Looking ahead, businesses expect little improvement in conditions over the next six months...The index for future prices paid fell a steep eighteen points, suggesting that, looking ahead, firms expect slower input price increases than they were anticipating last month.” Report at....
https://www.newyorkfed.org/survey/empire/empiresurvey_overview
RETAIL SALES (CNN)
“Americans pulled back on their spending last month after a surprisingly spendy January. US retail sales fell 0.4% in February from the month before, the Department of Commerce reported on Wednesday. That drop, which was adjusted for seasonal swings, was greater than economists’ expectations of a 0.3% decline...” Story at...
https://www.cnn.com/2023/03/15/economy/retail-sales-february/index.html
PPI (CNBC)
“Wholesale prices posted an unexpected decline in February, providing some encouraging news on inflation as the Federal Reserve weighs its next move on interest rates. The producer price index fell 0.1% for the month, against the Dow Jones estimate for a 0.3% increase and compared with a 0.3% gain in January...” Story at...
https://www.cnbc.com/2023/03/15/ppi-february-2023-.html
VOLATILITY RISING BUT NOWHERE NEAR 2008 – Excerpt.
(Heritage Capital, 3/15)
“I am still surprised that Silicon Valley Bank (SVB) created so much panic and anxiety over the weekend since the news broke on Friday. I guess losing two banks in the blink of an eye with the second and third largest failures in history reminded too many people of 2008. As I have said too many times to count, this is not 2008. It’s not even close... it goes without saying that banks absolutely need to calm down and bounce at least 10%. The stock market will have a tough time sustaining higher prices without the financials. It still appears as though the final low for this pullback is not in yet. We will take it day by day and see what shakes.” – Paul Schatz, President Heritage Capital. Commentary at...
https://investfortomorrow.com/blog/volatility-rising-but-nowhere-close-to-2008-or-even-2022/
My cmt: Always good to hear from a finance professional who agrees with me, although I am hopeful that the S&P 500 will not drop below recent lows of around 3850.
MARKET REPORT / ANALYSIS
-Wednesday the S&P 500 dropped about 0.7% to 3892 (It gave back less than half of yesterday’s gain).
-VIX rose about 10% to 26.14.
-The yield on the 10-year Treasury fell to 3.466%.
PULLBACK DATA:
-Drop from Top: 18.9% as of today. 25.4% max (on a closing basis).
-Trading Days since Top: 300-days.
The S&P 500 is 1.2% BELOW its 200-dMA & 2.8% BELOW its 50-dMA.
*I won’t call the correction over until the S&P 500 makes a new-high; however, evidence suggests the bottom was in the 3600 area.
MY TRADING POSITIONS:
I am not trading as much as in the past. You may wish to use the momentum charts and/or the Monday 40-day gain charts for trading the Dow stocks and ETFs.
QLD – 2xNasdaq 100
SSO – 2x S&P 500
XLK – Technology ETF.
XLE – Energy Sector ETF. It hasn’t been doing much recently, but Russia is cutting production and that should help the sector. We have a good dividend in the meantime.
BA – (Boeing) I am late on this one, but we’ll see.
XLY - Consumer Discretionary ETF.
SHY – Short term bonds. 30-day yield is 4.6%. (Trailing
1-year yield is 1.3%.) I’ll hold this, but if the market retests the lows, I’ll
sell it and buy stocks.)
TODAY’S COMMENT:
There was very high-volume today, Wednesday, about 45% above the daily-normal for the month. I heard the word “panic” used to describe today’s market action on CNBC and that’s probably a good description. The good news is that markets recovered after the European Central Bank said they would backstop Credit Suisse (the European bank run) as needed and the Nasdaq finished slightly higher for the day.
In addition to the internals and technical indicators I
usually watch, I think we need to watch the price action. Markets are all about
the news and the actions of panicky investors; it will take a few days for the
smoke to clear. It’s possible the Fed may pause its rate hikes next week due to
the bank failures. If that happens the stock market should make some rapid
gains. On the money management side, I want to see the S&P 500 remain above
its recent lows around 3850. A drop lower than that level would be time for me
to do some selling.
Around mid-day today I wrote, “There are no similarities
between current conditions and 2008.” I won’t bother to say more since Paul Schatz
said it well in the commentary above.
My Money Trend indicator fell again today. As I wrote yesterday, that’s bearish and I
hope it is a fake out. The good news is
that new bull signs remain today. The short-term Fosback Hi-lo Logic Index got
more bullish; the Long term version of the Fosback Index remains bullish; and
the smoothed advancing volume on the NYSE remained bullish. I still think the
recent stock market weakness is winding down (I thought it was over yesterday)
since Central Banks have stepped in.
Today, the daily spread of 20 Indicators (Bulls minus
Bears) improved from -4 to -3 (a positive number is bullish; negatives are
bearish); the 10-day smoothed sum that smooths the daily fluctuations declined
from -14 to -16. (The trend direction is more important than the actual number
for the 10-day value.) These numbers sometimes change after I post the blog
based on data that comes in late. Most of these 20 indicators are short-term so
they tend to bounce around a lot.
LONG-TERM INDICATOR: The Long Term NTSM indicator was
HOLD: VIX is bearish; VOLUME, PRICE & SENTIMENT are neutral
(The important BUY in this indicator was on 21 October,
7-days after the bottom. For my NTSM overall signal, I suggested that a
short-term buying opportunity occurred on 27 September (based on improved
market internals on the retest), although without market follow-thru, I was
unwilling to call a buy; however, I did close shorts and increased stock
holdings. I issued a Buy-Signal on 4 October, 6-days before the final bottom,
based on stronger market action that confirmed the market internals signal. The
NTSM sell-signal was issued 20 December, 8 sessions before the high of this
recent bear market, based on the bearish Friday rundown of indicators.)
Bottom line: I am more positive now, but perhaps not a
complete bull yet. The S&P 500 needs to climb back above its 200-dMA. Then
I’ll be a bull.
ETF - MOMENTUM ANALYSIS:
TODAY’S RANKING OF 15 ETFs (Ranked Daily)
ETF ranking follows:
 The top ranked ETF receives
100%. The rest are then ranked based on their momentum relative to the leading
ETF.
The top ranked ETF receives
100%. The rest are then ranked based on their momentum relative to the leading
ETF.
*For additional background on the ETF ranking system see NTSM Page at…
http://navigatethestockmarket.blogspot.com/p/exchange-traded-funds-etf-ranking.html
DOW STOCKS - TODAY’S MOMENTUM RANKING
OF THE DOW 30 STOCKS (Ranked Daily)
DOW 30 momentum ranking follows:
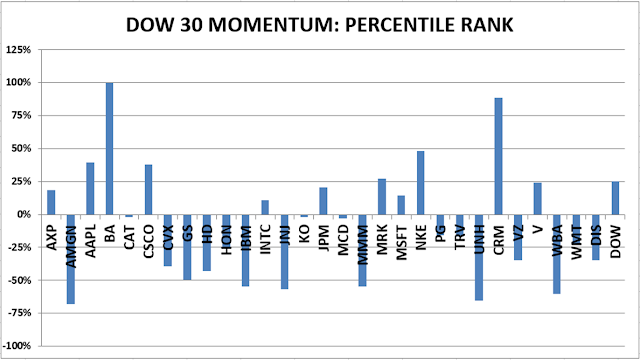
The top ranked Stock receives 100%. The rest are then ranked based on their momentum relative to the leading Stock.
For more details, see NTSM Page at…
https://navigatethestockmarket.blogspot.com/p/a-system-for-trading-dow-30-stocks-my_8.html
WEDNESDAY MARKET INTERNALS
(NYSE DATA)
 My basket of Market Internals remained HOLD. (Market Internals are a
decent trend-following analysis of current market action, but should not be
used alone for short term trading. They are most useful when they diverge from
the Index.)
My basket of Market Internals remained HOLD. (Market Internals are a
decent trend-following analysis of current market action, but should not be
used alone for short term trading. They are most useful when they diverge from
the Index.)

...My current invested
position is about 75% stocks, including stock mutual funds and ETFs. I’m
usually about 50% invested in stocks and I’ll reduce stock holdings if the
S&P 500 can’t close in positive territory Tuesday.
I trade about 15-20% of the
total portfolio using the momentum-based analysis I provide here. If I can see
a definitive bottom, I’ll add a lot more stocks to the portfolio using an
S&P 500 ETF.
“Business activity continued to decline in New York State, according to firms responding to the March 2023 Empire State Manufacturing Survey. The headline general business conditions index fell nineteen points to -24.6. New orders dropped significantly, and shipments declined modestly... Looking ahead, businesses expect little improvement in conditions over the next six months...The index for future prices paid fell a steep eighteen points, suggesting that, looking ahead, firms expect slower input price increases than they were anticipating last month.” Report at....
https://www.newyorkfed.org/survey/empire/empiresurvey_overview
“Americans pulled back on their spending last month after a surprisingly spendy January. US retail sales fell 0.4% in February from the month before, the Department of Commerce reported on Wednesday. That drop, which was adjusted for seasonal swings, was greater than economists’ expectations of a 0.3% decline...” Story at...
https://www.cnn.com/2023/03/15/economy/retail-sales-february/index.html
“Wholesale prices posted an unexpected decline in February, providing some encouraging news on inflation as the Federal Reserve weighs its next move on interest rates. The producer price index fell 0.1% for the month, against the Dow Jones estimate for a 0.3% increase and compared with a 0.3% gain in January...” Story at...
https://www.cnbc.com/2023/03/15/ppi-february-2023-.html
“I am still surprised that Silicon Valley Bank (SVB) created so much panic and anxiety over the weekend since the news broke on Friday. I guess losing two banks in the blink of an eye with the second and third largest failures in history reminded too many people of 2008. As I have said too many times to count, this is not 2008. It’s not even close... it goes without saying that banks absolutely need to calm down and bounce at least 10%. The stock market will have a tough time sustaining higher prices without the financials. It still appears as though the final low for this pullback is not in yet. We will take it day by day and see what shakes.” – Paul Schatz, President Heritage Capital. Commentary at...
https://investfortomorrow.com/blog/volatility-rising-but-nowhere-close-to-2008-or-even-2022/
My cmt: Always good to hear from a finance professional who agrees with me, although I am hopeful that the S&P 500 will not drop below recent lows of around 3850.
-Wednesday the S&P 500 dropped about 0.7% to 3892 (It gave back less than half of yesterday’s gain).
-VIX rose about 10% to 26.14.
-The yield on the 10-year Treasury fell to 3.466%.
-Drop from Top: 18.9% as of today. 25.4% max (on a closing basis).
-Trading Days since Top: 300-days.
The S&P 500 is 1.2% BELOW its 200-dMA & 2.8% BELOW its 50-dMA.
*I won’t call the correction over until the S&P 500 makes a new-high; however, evidence suggests the bottom was in the 3600 area.
I am not trading as much as in the past. You may wish to use the momentum charts and/or the Monday 40-day gain charts for trading the Dow stocks and ETFs.
QLD – 2xNasdaq 100
SSO – 2x S&P 500
XLK – Technology ETF.
XLE – Energy Sector ETF. It hasn’t been doing much recently, but Russia is cutting production and that should help the sector. We have a good dividend in the meantime.
BA – (Boeing) I am late on this one, but we’ll see.
XLY - Consumer Discretionary ETF.
There was very high-volume today, Wednesday, about 45% above the daily-normal for the month. I heard the word “panic” used to describe today’s market action on CNBC and that’s probably a good description. The good news is that markets recovered after the European Central Bank said they would backstop Credit Suisse (the European bank run) as needed and the Nasdaq finished slightly higher for the day.
ETF - MOMENTUM ANALYSIS:
TODAY’S RANKING OF 15 ETFs (Ranked Daily)
ETF ranking follows:
*For additional background on the ETF ranking system see NTSM Page at…
http://navigatethestockmarket.blogspot.com/p/exchange-traded-funds-etf-ranking.html
DOW 30 momentum ranking follows:
The top ranked Stock receives 100%. The rest are then ranked based on their momentum relative to the leading Stock.
For more details, see NTSM Page at…
https://navigatethestockmarket.blogspot.com/p/a-system-for-trading-dow-30-stocks-my_8.html