Friday, January 25, 2019

Bulls and Bears … Correction Update … Stock Market Analysis… ETF Trading … Dow 30 Ranking

CHARTS BULLS & BEARS SHOULD CONSIDER (Real Investment Advice - Excerpt)
“Understanding…bullish arguments is important. But more importantly is the understanding that many of these beliefs have already begun to deteriorate and are substantially increasing the risk to investors and their capital. The markets will not rise indefinitely, and the eventual mean reversion will be more destructive than most realize. Unfortunately, since most individuals only consider the “bull case,” as it creates confirmation bias for their “greed” emotion, they never see the “train coming.” Commentary at…
Here’s just one of the charts presented I the piece at RIA.
 
CORRECTION UPDATE
This is day 86 of this correction (assuming we haven’t made a bottom yet).  As of today’s close, the Index is down 9.1% (19.8% max) from its prior high and has included 21 new-lows. In recent years only the 2011 correction contained 21 new-lows. That correction bottomed at 19.4%.
 
Over the last 20-years (excluding major crashes and the current year) there have been 2 corrections that exceeded 19%, in 1998 and 2011. In 2011, the waterfall phase (nearly straight down with little or no bounces) took place over 3-weeks (about 15-trading sessions) and included a 17% drop with almost no relief. In 2018, the waterfall phase that ended Christmas Eve lasted 3-weeks over 15-trading sessions and included a drop of 16%. Both corrections included a retest of the initial low.
 
The 2011 correction took 108-days to complete, top to bottom.
 
MARKET REPORT / ANALYSIS         
-Friday the S&P 500 was up about 0.9% to 2665.
-VIX dropped about 8% to 17.42. 
-The yield on the 10-year Treasury rose to 2.759%.
 
I am surprised…Intel reported after hours yesterday and gave weak revenue guidance and weak forward earnings guidance. Its stock was down 7% after hours yesterday and they blamed weak China sales for their troubles. Today the market was up from the open and made a 1% gain by 1100. What am I missing? One would have expected a terrible day, based on the Intel news; but perhaps there is more to the story…
 
This afternoon, Trump announced Government would reopen for three weeks to allow for negotiations. That’s why the market was up this morning! The Administration’s move to reopen Government was probably leaked and the market rose at the open, hours before the official notice. Another case where the sheep don’t have the inside advantage.  Actually, the closure is the least of our worries and the Pros seem to agree; there was a mild drop in the S&P 500 after the announcement along with bigger declines in the Nasdaq and the Dow. 
 
Major issues remain: (1) China’s economy which is may lead to Asian Contagion for the US economy. (2) FED tightening that includes Interest rate hikes and Quantitative Tightening. (3) Tariffs (4) Oil Prices and more. Whether those issues will cause the Markets to dip from here remains a point of discussion.
 
On the day, we saw that the S&P 500 tried to break above the recent rebound high of 2671; it failed and closed at 2665.
 
We said that the close at 2671 last week was probably a Top. Based on the evidence so far, we haven’t seen anything to change that view. Internals improved today, but there were still plenty of negatives. 
 
The overbought/oversold ratio remains overbought. 
 
My Money Trend indicator is still headed down and that’s a bearish sign. (This indicator attempts to follow the general concept of Lowry Research and their supply and demand methodology for stock market analysis. Their concept is based on a detailed stock-by-stock analysis while mine is an estimate based on readily available Macro data.  Theirs is much more accurate, but that doesn’t mean mine isn’t useful.)
 
My daily sum of 17 Indicators declined from +4 to +3 (a positive number is bullish; negatives are bearish) while the 10-day smoothed version that negates the daily fluctuations declined from +64 to +57. I tend to watch the 10-day direction of this indicator and for now it is headed down, a bearish sign.
 
Repeating what I’ve been saying for a while:
A “V”-bottom is very unusual and I don’t think it is likely that this correction will race to a top without a retest of the prior low at 2351. I sold the rally and cut my stock holdings back to about 30%, 9 January to reduce risk. Only a retest at the 2351 level, or a climb back above the old highs (not likely without a retest), will tell us whether 2351 was THE bottom.
 
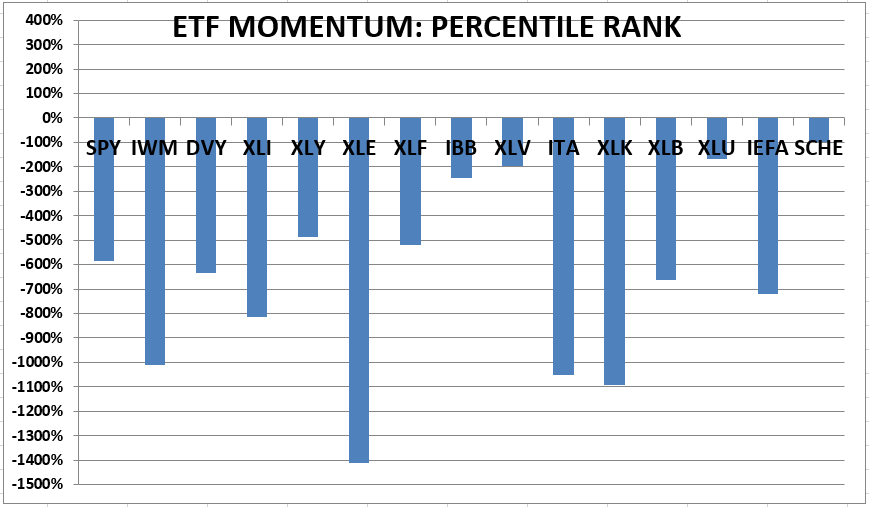
MOMENTUM ANALYSIS:
(Momentum analysis is suspect in a selloff, so I‘d be careful using momentum data for the time being – the only reason utilities are highly ranked among ETFs is as an alternative to stocks during the correction.)  The same is true for individual stocks in the Dow 30.
TODAY’S RANKING OF  15 ETFs (Ranked Daily)
The top ranked ETF receives 100%. The rest are then ranked based on their momentum relative to the leading ETF.  While momentum isn’t stock performance per se, momentum is closely related to stock performance. For example, over the 4-months from Oct thru mid-February 2016, the number 1 ranked Financials (XLF) outperformed the S&P 500 by nearly 20%. In 2017 Technology (XLK) was ranked in the top 3 Momentum Plays for 52% of all trading days in 2017 (if I counted correctly.) XLK was up 35% on the year while the S&P 500 was up 18%.
*For additional background on the ETF ranking system see NTSM Page at…
 
TODAY’S RANKING OF THE DOW 30 STOCKS (Ranked Daily)
The top ranked stock receives 100%. The rest are then ranked based on their momentum relative to the leading stock.
*I rank the Dow 30 similarly to the ETF ranking system. For more details, see NTSM Page at…
 
FRIDAY MARKET INTERNALS (NYSE DATA)
Market Internals remained NEUTRAL on the market.
Market Internals are a decent trend-following analysis of current market action but should not be used alone for short term trading. They are usually right, but they are often late.  They are most useful when they diverge from the Index.  In 2014, using these internals alone would have made a 9% return vs. 13% for the S&P 500 (in on Positive, out on Negative – no shorting). 
 
My current stock allocation is about 30% invested in stocks on as of 9 January 2019. For me, fully invested is a balanced 50% stock portfolio so this is a very conservative position.
 
INTERMEDIATE / LONG-TERM INDICATOR
Friday, only the Sentiment indicator was positive; The Volume, VIX and Price indicators were neutral. Overall this is a NEUTRAL indication. The longer/intermediate-term version of Sentiment is neutral.

Thursday, January 24, 2019

Jobless Claims … Leading Economic Indicators … Stock Market Analysis… ETF Trading … Dow 30 Ranking

JOBLESS CLAIMS (Reuters)
“The number of Americans filing applications for unemployment benefits fell to more than a 49-year low last week, but the drop likely overstates the health of the labor market as claims for several states including California were estimated…Initial claims for state unemployment benefits dropped 13,000 to a seasonally adjusted 199,000 for the week ended Jan. 19…” Story at…
 
LEI (Conference Board)
"The U.S. LEI declined slightly in December and the recent moderation in the LEI suggests that the U.S. economic growth rate may slow down this year," said Ataman Ozyildirim, Director of Economic Research at The Conference Board. "While the effects of the government shutdown are not yet reflected here, the LEI suggests that the economy could decelerate towards 2 percent growth by the end of 2019." Press release at…
 
CRUDE OIL INVENTORIES (OilPrice.com)
“U.S. crude oil inventories went up by 8 million barrels in the week to January 18, the Energy Information Administration said in its latest weekly petroleum status report. At 445 million barrels, these were about 9 percent above seasonal limits…Oil prices began to settle this week, despite persistent worry about the global economy, after reports emerged that Asian government were considering fiscal stimulus measure in anticipation of the slowdown.” Story at…
 
MARKET REPORT / ANALYSIS         
-Thursday the S&P 500 was up about 0.2% to 2639.
-VIX dropped about 3% to 18.89. 
-The yield on the 10-year Treasury dipped to 2.714%.
 
We said that Friday was probably a Top. Based on the evidence so far, we haven’t seen anything to change that view. Internals improved today, but there were still plenty of negatives.  
 
The overbought/oversold ratio is still overbought.  Today, RSI flipped to overbought, too.  Bollinger bands are not overbought, but Bollinger bands were very close to overbought last week. I like to watch RSI and the Bollinger Bands together.
 
My Money Trend indicator is still headed down and that’s a bearish sign. (This indicator attempts to follow the general concept of Lowry Research and their supply and demand methodology for stock market analysis. Their concept is based on a detailed stock-by-stock analysis while mine is an estimate based on readily available Macro data.  Theirs is much more accurate, but that doesn’t mean mine isn’t useful.)
 
My daily sum of 17 Indicators improved from +1 to +4 (a positive number is bullish; negatives are bearish) while the 10-day smoothed version that negates the daily fluctuations declined from +70 to +64. I tend to watch the 10-day direction of this indicator and for now it is headed down, a bearish sign. Since the daily value was up today, I’ll be watching tomorrow to see where this indicator is headed.
 
Repeating what I’ve been saying for a while:
A “V”-bottom is very unusual and I don’t think it is likely that this correction will race to a top without a retest of the prior low at 2351. I sold the rally and cut my stock holdings back to about 30%, 9 January to reduce risk. Only a retest at the 2351 level, or a climb back above the old highs (not likely without a retest), will tell us whether 2351 was THE bottom.
 
MOMENTUM ANALYSIS:
(Momentum analysis is suspect in a selloff, so I‘d be careful using momentum data for the time being – the only reason utilities are highly ranked among ETFs is as an alternative to stocks during the correction.)  The same is true for individual stocks in the Dow 30.
TODAY’S RANKING OF  15 ETFs (Ranked Daily)
The top ranked ETF receives 100%. The rest are then ranked based on their momentum relative to the leading ETF.  While momentum isn’t stock performance per se, momentum is closely related to stock performance. For example, over the 4-months from Oct thru mid-February 2016, the number 1 ranked Financials (XLF) outperformed the S&P 500 by nearly 20%. In 2017 Technology (XLK) was ranked in the top 3 Momentum Plays for 52% of all trading days in 2017 (if I counted correctly.) XLK was up 35% on the year while the S&P 500 was up 18%.
*For additional background on the ETF ranking system see NTSM Page at…
 
TODAY’S RANKING OF THE DOW 30 STOCKS (Ranked Daily)
The top ranked stock receives 100%. The rest are then ranked based on their momentum relative to the leading stock.
*I rank the Dow 30 similarly to the ETF ranking system. For more details, see NTSM Page at…
 
THURSDAY MARKET INTERNALS (NYSE DATA)
Market Internals remained NEUTRAL on the market.
Market Internals are a decent trend-following analysis of current market action but should not be used alone for short term trading. They are usually right, but they are often late.  They are most useful when they diverge from the Index.  In 2014, using these internals alone would have made a 9% return vs. 13% for the S&P 500 (in on Positive, out on Negative – no shorting). 
 
My current stock allocation is about 30% invested in stocks on as of 9 January 2019. For me, fully invested is a balanced 50% stock portfolio so this is a very conservative position.
 
INTERMEDIATE / LONG-TERM INDICATOR
Thursday, the Sentiment and Price indicators were positive; The Volume and VIX indicators were neutral. Overall this is a NEUTRAL indication. The longer/intermediate-term version of Sentiment is neutral.

Wednesday, January 23, 2019

S&P 500 Earnings Cuts … Another FED Fake Out … Under Pricing Risk … Stock Market Analysis… ETF Trading … Dow 30 Ranking

“The world’s economy is growing more slowly than expected and risks are rising.” – Christine Lagarde, IMF Managing Director
 
LARGEST CUTS OF S&P 500 EPS ESTIMATES IN 4 YEARS – EXCERPT (FactSet)
“…the bottom-up EPS [Earnings per Share] estimate for the first half of 2019 (1H 2019) decreased by 4.5% (to $81.73 from $85.56) over the past three months...the 4.5% decline marked the largest decrease since 1H 2015 (-6.6%) and the fourth largest decrease since 1H 2004…” 
my cmt: There was a 5.2% EPS decline in 1H2008 and a 24.1% decline in 1H2009, the crash years. The current data doesn’t mean there is a crash coming, but earnings are going the wrong way while the FED is tightening rather than loosening. It does not pay to be complacent now. A crash is possible, but likely a less than 50% probability.
 
ANOTHER #FEDFAKE
I used to think the trader talk about Government “Plunge Protection Teams” propping up the markets couldn’t be true; but as shown in the following chart, when the dips have occurred, world-wide Central Bank Balance sheets have dramatically increased. With the FED now trying to cut its balance sheet, one wonders whether the US markets can get back to the prior highs. As Jesse Columbo of real Investment Advice noted last week, “If the “market” heads higher from here, that just means more rate hikes are back on the table.” See “Another #FedFake” at…

Chart from ZeroHedge.
 
UNDER PRICING RISK (Real Investment Advice)
“Excessive pessimism and poor price action contributed to a Christmas Eve low which provided an opportunity to go long. Excessive optimism and good price action is now contributing to a late January high which might be providing an opportunity to sell stocks. Sorry, Ethel, everything is not coming up roses.” – Lance Roberts. Commentary at…
 
MARKET REPORT / ANALYSIS         
-Wednesday the S&P 500 was up about 0.2% to 2639.
-VIX dropped about 6% to 19.52. 
-The yield on the 10-year Treasury was little changed at 2.742%.
 
We noted that Friday was probably a short-term top, based on the evidence. We haven’t seen anything to change that view.
 
My Money Trend indicator is still headed down and that’s a bearish sign. (This indicator attempts to follow the general concept of Lowry Research and their supply and demand methodology for stock market analysis. Their concept is based on a detailed stock-by-stock analysis while mine is an estimate based on readily available Macro data.  Theirs is much more accurate, but that doesn’t mean mine isn’t useful.)
 
My daily sum of 17 Indicators was unchanged at +1 (a positive number is bullish; negatives are bearish) while the 10-day smoothed version that negates the daily fluctuations declined from +77 to +70. I tend to watch the direction of this indicator and for now it is headed down, a bearish sign.
 
Repeating what I’ve been saying for a while:
A “V”-bottom is very unusual and I don’t think it is likely that this correction will race to a top without a retest of the prior low at 2351. I sold the rally and cut my stock holdings back to about 30%, 9 January to reduce risk. Only a retest at the 2351 level, or a climb back above the old highs (not likely without a retest), will tell us whether 2351 was THE bottom.
 
MOMENTUM ANALYSIS:
(Momentum analysis is suspect in a selloff, so I‘d be careful using momentum data for the time being – the only reason utilities are highly ranked among ETFs is as an alternative to stocks during the correction.)  The same is true for individual stocks in the Dow 30.
TODAY’S RANKING OF  15 ETFs (Ranked Daily)
The top ranked ETF receives 100%. (In this case -100% since all are negative.) The rest are then ranked based on their momentum relative to the leading ETF.  While momentum isn’t stock performance per se, momentum is closely related to stock performance. For example, over the 4-months from Oct thru mid-February 2016, the number 1 ranked Financials (XLF) outperformed the S&P 500 by nearly 20%. In 2017 Technology (XLK) was ranked in the top 3 Momentum Plays for 52% of all trading days in 2017 (if I counted correctly.) XLK was up 35% on the year while the S&P 500 was up 18%.
*For additional background on the ETF ranking system see NTSM Page at…
 
TODAY’S RANKING OF THE DOW 30 STOCKS (Ranked Daily)
The top ranked stock receives 100%. The rest are then ranked based on their momentum relative to the leading stock.
*I rank the Dow 30 similarly to the ETF ranking system. For more details, see NTSM Page at…
 
WEDNESDAY MARKET INTERNALS (NYSE DATA)
Market Internals remained NEUTRAL on the market.
 Market Internals are a decent trend-following analysis of current market action but should not be used alone for short term trading. They are usually right, but they are often late.  They are most useful when they diverge from the Index.  In 2014, using these internals alone would have made a 9% return vs. 13% for the S&P 500 (in on Positive, out on Negative – no shorting). 
 
My current stock allocation is about 30% invested in stocks on as of 9 January 2019. For me, fully invested is a balanced 50% stock portfolio so this is a very conservative position.
 
INTERMEDIATE / LONG-TERM INDICATOR
Wednesday, the Sentiment and Price indicators were positive; The Volume and VIX indicators were neutral. Overall this is a NEUTRAL indication. The longer/intermediate-term version of Sentiment is neutral.

Tuesday, January 22, 2019

JP Morgan 2019 Outlook … Existing Home sales … Jeffrey Saut Commentary Excerpt … Stock Market Analysis… ETF Trading … Dow 30 Ranking

“…my real problems were a failure to cut losses short, an inability to be disciplined, difficulty admitting mistakes, fear and greed, and a lack of risk management, none of which had much to do with being right in the stock market world. It was thus a lack of proper investment strategy, not forecasting, that was holding me back.” – Ned Davis, Ned Davis Research.
 
J.P. MORGAN COMMENT FOR 2019
“While equity valuations are much cheaper after the fall selloff, tighter monetary policy, shrinking excess capacity, slower global growth and unresolved trade issues will limit the market rebound in 2019. While we expect US GDP and profits to continue to rise, they don’t always translate into rising asset prices this late in the cycle, particularly with the shift by the Trump administration away from its market-friendly 2017 policies.” – J.P. Morgan
 
HOME SALES (MarketWatch)
“Existing-home sales ran at a seasonally adjusted annual rate of 4.99 million in December, the National Association of Realtors said Tuesday. That was the lowest since November 2015. Sales were down 6.4% for the month, and 10.3% lower than the year-ago rate.” Story at…
 
JEFFREY SAUT COMMENTARY EXCERPT (Raymond James)
“…in the short term, the equity markets have gone from extremely oversold to extremely overbought in one of the shortest times in history…Therefore, even though the SPX has exceeded our upside target range (2600-2650), we are sticking with our more cautious investment stance at these levels.” – Jeffrey Saut. Commentary at…
 
MARKET REPORT / ANALYSIS         
-Tuesday the S&P 500 was down about 1.4% to 2633.
-VIX rose about 17% to 20.80. 
-The yield on the 10-year Treasury was dipped to 2.740%.
 
We said Friday, that Friday was probably a Top, based on the evidence. Today, it looks like a lot of other people came to the same conlcusion.
 
Tuesday was a Statistically-Significant down-day. That means that the price-volume move exceeded my statistical parameters.  Stats show that an up-day occurs in the next trading session about 60% of the time after a statistically significant down-day.
 
My Money Trend indicator is still headed down and that’s a bearish sign . (This indicator attempts to follow the general concept of Lowry Research and their supply and demand methodology for stock market analysis. Their concept is based on a detailed stock-by-stock analysis while mine is an estimate based on readily available Macro data.  Theirs is much more accurate, but that doesn’t mean mine isn’t useful.)
 
My daily sum of 17 Indicators declined from +7 to +1 (a positive number is bullish; negatives are bearish) while the 10-day smoothed version that negates the daily fluctuations declined from +86 to +77. I tend to watch the direction of this indicator and for now it is headed down, a bearish sign.
 
Today there were a lot more negative indicators and that’s not a good sign for the bulls.  Repeating what I’ve been saying for a while:
A “V”-bottom is very unusual and I don’t think it is likely that this correction will race to a top without a retest of the prior low at 2351. I sold the rally and cut my stock holdings back to about 30%, 9 January to reduce risk. (The Index is up about 3% since  then.)  Only a retest at the 2351 level, or a climb back above the old highs (not likely without a retest), will tell us whether 2351 was THE bottom.
 
MOMENTUM ANALYSIS:
(Momentum analysis is suspect in a selloff, so I‘d be careful using momentum data for the time being – the only reason utilities are highly ranked among ETFs is as an alternative to stocks during the correction.)  The same is true for individual stocks in the Dow 30.
TODAY’S RANKING OF  15 ETFs (Ranked Daily)
The top ranked ETF receives 100%. The rest are then ranked based on their momentum relative to the leading ETF.  While momentum isn’t stock performance per se, momentum is closely related to stock performance. For example, over the 4-months from Oct thru mid-February 2016, the number 1 ranked Financials (XLF) outperformed the S&P 500 by nearly 20%. In 2017 Technology (XLK) was ranked in the top 3 Momentum Plays for 52% of all trading days in 2017 (if I counted correctly.) XLK was up 35% on the year while the S&P 500 was up 18%.
*For additional background on the ETF ranking system see NTSM Page at…
 
TODAY’S RANKING OF THE DOW 30 STOCKS (Ranked Daily)
The top ranked stock receives 100%. The rest are then ranked based on their momentum relative to the leading stock.
*I rank the Dow 30 similarly to the ETF ranking system. For more details, see NTSM Page at…
 
TUESDAY MARKET INTERNALS (NYSE DATA)
Market Internals dropped to NEUTRAL on the market.
Market Internals are a decent trend-following analysis of current market action but should not be used alone for short term trading. They are usually right, but they are often late.  They are most useful when they diverge from the Index.  In 2014, using these internals alone would have made a 9% return vs. 13% for the S&P 500 (in on Positive, out on Negative – no shorting). 
 
My current stock allocation is about 30% invested in stocks on as of 9 January 2019. For me, fully invested is a balanced 50% stock portfolio so this is a very conservative position.
 
INTERMEDIATE / LONG-TERM INDICATOR
Tuesday, the Sentiment and Volume indicators were positive; The Price and VIX indicators were neutral. Overall this is a POSITIVE indication, BUT IT MAY BE TOO EARLY to Buy now since we expect a retest of the low.  It does indicate that conditions have greatly improved. Bullish Sentiment is based on the short-term/intermediate version of this indicator.  The longer-term version is neutral for Sentiment so longer term, the Indicator is Neutral.

Monday, January 21, 2019

Vote Against ALL Incumbents – It’s the only term limit we have!

DEMOCRATS WERE FOR A WALL BEFORE THEY WERE AGAINST IT (Washington Post)
“In 2019, the federal government will spend a whopping $4.407 trillion. Yet Congress and the president are shutting down the government in a dispute between the $1.3 billion the Democrats have approved for border security and the $5.7 billion the president is demanding — the difference being precisely 0.0998 percent of the total federal budget. In Washington, that is considered a rounding error.
 
Worse, Democrats are doing it over a border wall strikingly similar to one that they almost unanimously supported just five years ago…
 
…If Democrats think they have Trump cornered, then squeeze him and try get a lot out of him. But don’t refuse to negotiate and tell us the wall is an “immorality” — because their voting history shows they don’t believe that.” – Marc Thiessen. Full piece at…
 

Sunday, January 20, 2019

Market Analysis … Momentum Ranking for the DOW and 15 ETFs for January 18, 2019

NYSE and Bond markets are closed tomorrow for Martin Luther King Day.
 
MARKET REPORT / ANALYSIS         
-Friday the S&P 500 was up about 1.3% to 2671.
-VIX fell about 1% to 17.80. 
-The yield on the 10-year Treasury was little changed at 2.786%.
 
Friday was a Statistically-Significant move up. That means that the price-volume move exceeded my statistical parameters.  Stats show that a down-day occurs about 60% of the time in the next trading day after a significant-up day. Significant up-days can indicate tops.  That would be expected now, since the market is in the zone where we had expected a retreat to begin. That zone is around the 50% retracement level and generally coincides with the 50-dMA. In fact, the S&P 500 is now 1.7% above its 50-dMA and has retraced about 55% off the low. This is also at the upper trend-line, although the trend line depends on the scales chosen for the charts used to graph the trend-lines.
 
We note some other bearish signals:
-The 150-dMA is still falling on the S&P 500.
-The overbought-oversold ratio is overbought.
-RSI is not quite overbought, but at 77 it is very close.  80 is overbought in my system. Bollinger Bands are close to overbought, but are not there yet.
-My Money Trend indicator is still headed down and it fell Friday even on the big bullish move up.
-New-highs are very low for what has been a huge move up over the last 17 trading sessions.
 
My daily sum of 17 Indicators declined from +10 to +7 (a positive number is bullish; negatives are bearish) while the 10-day smoothed version that negates the daily fluctuations declined from +88 to +86.
 
Repeating: A “V”-bottom is very unusual and I don’t think it is likely that this correction will race to a top without a retest of the prior low at 2351. I sold the rally and cut my stock holdings back to about 30%, 9 January to reduce risk. (The Index is up about 3% since  then.)  Only a retest at the 2351 level, or a climb back above the old highs (not likely without a retest), will tell us whether 2351 was THE bottom.
 
MOMENTUM ANALYSIS:
(Momentum analysis is suspect in a selloff, so I‘d be careful using momentum data for the time being – the only reason utilities are highly ranked among ETFs is as an alternative to stocks during the correction.)  The same is true for individual stocks in the Dow 30.
TODAY’S RANKING OF  15 ETFs (Ranked Daily)
The top ranked ETF receives 100%. The rest are then ranked based on their momentum relative to the leading ETF.  While momentum isn’t stock performance per se, momentum is closely related to stock performance. For example, over the 4-months from Oct thru mid-February 2016, the number 1 ranked Financials (XLF) outperformed the S&P 500 by nearly 20%. In 2017 Technology (XLK) was ranked in the top 3 Momentum Plays for 52% of all trading days in 2017 (if I counted correctly.) XLK was up 35% on the year while the S&P 500 was up 18%.
*For additional background on the ETF ranking system see NTSM Page at…
 
TODAY’S RANKING OF THE DOW 30 STOCKS (Ranked Daily)
The top ranked stock receives 100%. The rest are then ranked based on their momentum relative to the leading stock.
*I rank the Dow 30 similarly to the ETF ranking system. For more details, see NTSM Page at…
 
FRIDAY MARKET INTERNALS (NYSE DATA)
Market Internals remained POSITIVE on the market.
Market Internals are a decent trend-following analysis of current market action but should not be used alone for short term trading. They are usually right, but they are often late.  They are most useful when they diverge from the Index.  In 2014, using these internals alone would have made a 9% return vs. 13% for the S&P 500 (in on Positive, out on Negative – no shorting). 
 
My current stock allocation is about 30% invested in stocks on as of 9 January 2019. For me, fully invested is a balanced 50% stock portfolio so this is a very conservative position.
 
INTERMEDIATE / LONG-TERM INDICATOR
Friday, the Sentiment and Volume indicators were positive; The Price and VIX indicators were neutral. Overall this is a POSITIVE indication, BUT IT MAY BE TOO EARLY to Buy now since we expect a retest of the low.  It does indicate that conditions have greatly improved. Bullish Sentiment is based on the short-term/intermediate version of this indicator.  The longer-term version is neutral for Sentiment so longer term, the Indicator is Neutral.