“Fewer Americans than forecast filed applications for unemployment benefits last week, further evidence of a healthy labor market. Jobless claims rose by 2,000 to 263,000 in the week ended Aug. 27….”
http://www.bloomberg.com/news/articles/2016-09-01/jobless-claims-in-u-s-increased-less-than-forecast-last-week
PRODUCTIVITY (MarketWatch)
“The productivity of American businesses and workers fell 0.6% in the second quarter instead of 0.5%, revised government figures show…Unit-labor costs jumped a revised 4.3% in the second quarter vs. an initial 2% reading.” Story at…
http://www.marketwatch.com/story/us-productivity-falls-sharper-06-in-second-quarter-2016-09-01
CONSTRUCTION SPENDING (US News)
“U.S. construction spending was unchanged in July as weakness in spending on government projects offset gains in home building and the strongest month for non-residential construction on record.” Story at…
http://www.usnews.com/news/business/articles/2016-09-01/us-construction-spending-unchanged-in-july
ISM INDEX (Reuters)
“U.S. factory activity contracted in August for the first time in six months as new orders and production tumbled, but a low level of layoffs continued to point to a pickup in economic growth in the third quarter...The Institute for Supply Management (ISM) said its index of national factory activity fell 3.2 percentage points to a reading of 49.4 last month” Story at…
http://www.reuters.com/article/us-usa-economy-idUSKCN1174T1
AUTO SALES (USA Today)
“General Motors and Ford Motor posted U.S. sales declines in August as the industry cooled off, fueling a growing perception that the auto industry topped out in late 2015 and early 2016.” Story at…
http://www.usatoday.com/story/money/cars/2016/09/01/general-motors-ford-motor-fiat-chrysler-august-2016-auto-sales/89708826/
PRICE TO SALES RATIO – FINAL NAIL ON THE COFFIN (Real Investment Advice)
“The graphs below chart the S&P 500 (blue line/top graph) and the median S&P 500 P/S ratio (red line/ bottom graph) since 1964. As shown in the bottom graph, the P/S [Price to Sales] ratio is now 2.50 standard deviations from the median and well above the prior levels preceding the significant bear markets of 2000-2002 and 2007-2009.”
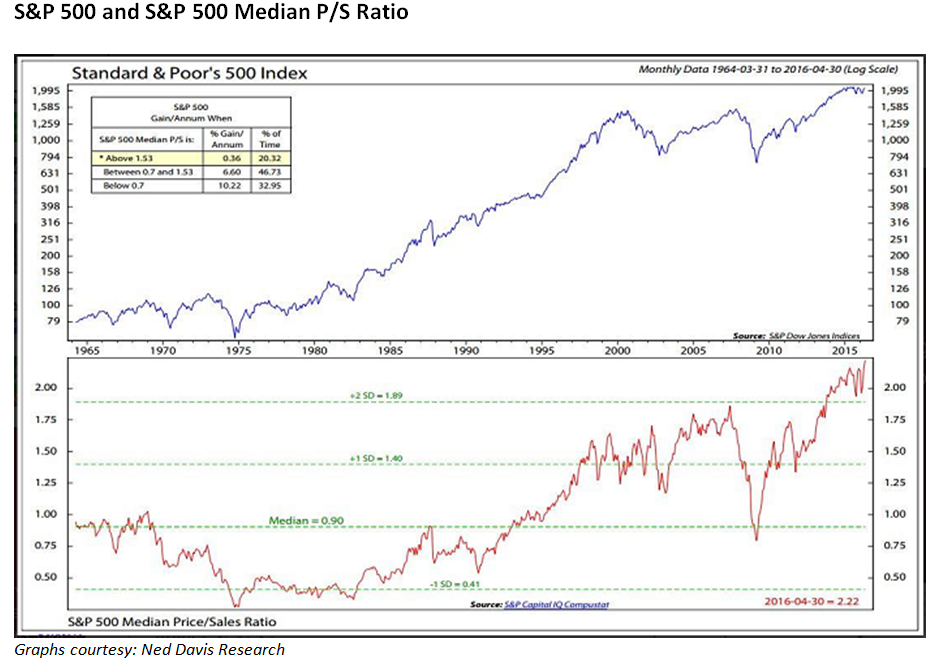

“…one should also consider the possibility that the next
correction will extract more than a pound of flesh in damage.” Commentary at…
https://realinvestmentadvice.com/price-to-sales-ratio-another-nail-in-the-coffin/MARKET REPORT / ANALYSIS
-Thursday the S&P 500 was unchanged at 2171.
-VIX rose about 0.5% to 13.48 at the close.
-The yield on the 10-year Treasury remained 1.57%.
Same as Yesterday: Thursday Bollinger Bands are again as close as they have been in the last 6-months. This officially qualifies as a “Bollinger Band Squeeze” and remains a bearish signal in the short-run. I’ve looked back as far as June of 2008 and couldn’t find a narrower squeeze than the one currently underway. This just shows that the markets are not very volatile and the daily moves are uniform. That is typically followed by a move down, but John Bollinger suggests that it means a breakout is coming and that could be up or down. My work suggests a move down, but it doesn’t have to be huge. I am guessing a roughly 5% pullback, but we’ll see.
While the S&P 500 topped out 2-weeks ago and it seems like it has gone down a lot since then, it hasn’t really. The Index is only down about 1% below its all-time high. I expect it will break down soon, but then I am seeing a lot of articles that are saying the same thing. When everyone agrees, the Market usually goes the other way.
VXX TRADE:
Thursday, the calm-before-the-storm indicator (low standard of deviation in recent market moves) still remains down and that suggests that VXX remained a buy as of Thursday’s close. While this has been going on for several weeks, it is not unusual. There is a lot of scatter in how long the indicator leads market action, and of course, the indicator is not perfect.
SHORT TRADE
I am still holding short positions, but I did exit some of the short positions and transitioned into VXX. (This books a loss for the trade for tax purposes and maintains a bearish stance.) I caution again to take it easy on this high risk stuff.
MONEY TREND INDICATOR
My short-term Money Trend indicator can be volatile; Thursday it remains trending down; a neutral to bearish indication. This indicator is down, but the index isn’t. Something is going to break soon.
MARKET INTERNALS (NYSE DATA)
The 10-day moving average of the percentage of stocks advancing (NYSE) dipped to 49.1% Thursday. It was 51.4% Wednesday. A number below 50% is usually BEARISH news for the markets.
On a longer term, the 150-day moving average of advancing stocks dipped to 54.6%. A value above 50% generally indicates an up-trend. The McClellan Oscillator dipped from -30 to -32 (percentage calculation method).
New-highs outpaced New-lows. The spread (new-highs minus new-lows) slipped to +78 Thursday. (It was +116 Wednesday.) The 10-day moving average of the change in spread was -8. In other words, over the last 10-days, on average, the spread has decreased by 8 each day. Market Internals switched to negative on the market.

Market Internals are a decent trend-following analysis of
current market action, but should not be used alone for short term trading.
They are usually right, but they are often late. They are most useful when they diverge from
the Index. In 2014, using these
internals alone would have made a 9% return vs. 13% for the S&P 500 (in on
Positive, out on Negative – no shorting).
LONG TERM INDICATOR
Thursday the Price indicator was positive; Sentiment, VIX and & Volume indicators were neutral. The long-term indicator is HOLD.

MY INVESTED STOCK POSITION:
TSP (RETIREMENT ACCOUNT – GOV EMPLOYEES) ALLOCATIONOn 12 July I increased my invested position in my retirement account to 25% invested in stocks thru an S&P 500 Index fund (“C”-fund in the TSP). I added to that position Thursday 21 July bringing my invested total up to 40% in stocks. I expect to add more stocks should we get the anticipated pullback.
The NTSM system indicated Buy at the 11 Feb bottom; and again 2-days after the bottom on high up-volume; and from 22 Feb thru 25 April. I ignored the early signals convinced that it was a bear market bounce; I ignored more recent signals due to overbought conditions. I’m following my system now, especially since the Index has climbed above my initial sell-point of 2100 on the S&P 500 back in November 2015.