“Trade what you see; not what you think.” – The Old Fool, Richard McCranie, trader extraordinaire.
“U.S. commercial crude oil inventories (excluding those in the Strategic Petroleum Reserve) decreased by 3.7 million barrels from the previous week. At 429.3 million barrels, U.S. crude oil inventories are about 6% below the five year average for this time of year.” Report at...
https://ir.eia.gov/wpsr/wpsrsummary.pdf
-Wednesday the S&P 500 declined about 0.8% to 5240.
-VIX rose about 0.5% to 27.85.
-The yield on the 10-year Treasury rose to 3.952% (compared to this time, prior trading day).
XLK – Holding since the October 2022 lows.
XLK – added more 7/26. This reestablishes the position I had before this recent weakness.
UWM – added 7/15.
QLD – added 7/24.
DWCPF - Dow Jones U.S. Completion Total Stock Market (TSM) Index, a broad market index made up of stocks of U.S. companies not included in the S&P 500 Index. – Added 7/29/2024
The Bull/Bear Spread count was 14 Bear-signs and 7-Bull. (The rest are neutral. It is normal to have a lot of neutral indicators since many of those are top or bottom indicators that will signal only at extremes.)
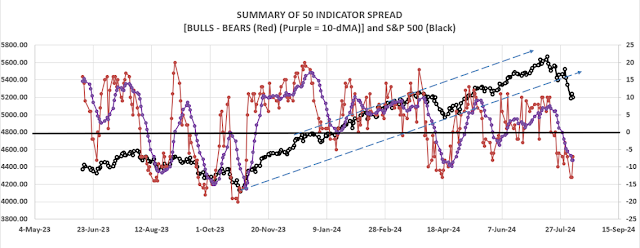
The Bull/Bear, 50-Indicator spread (Bull Indicators minus Bear Indicators) improved from -13 to -7 (7 more Bear indicators than Bull indicators). The 10-dMA continued to fall, but its rate of change declined suggesting a bounce higher may be coming.

No follow-thru today, but it’s not all bad; the S&P 500 finished just 0.2% above its recent low. I didn’t get the lower-low I was hoping for, but it may have been close enough. Volume was lower, market internals improved and indicators improved too. Maybe tomorrow will give us a better retest or a more conclusive bullish move. My signals aren’t too storng so if we see a bullish move, it would siggest investors agree that this pullback is nearly over. There are other possibiities, but et’s remain optimistic. .
(The Long-Term Indicator is not a good top-indicator. It can signal BUY at a top.)
The S&P 500 came very close to its prior low retesting the low. Results were bullish, but perhaps not conclusive. We’ll have to wait for more signals to see if we can call an end to the pullback. I am holding my trading positions, because I feel that it is too late to sell. The dip was so fast that it caught me off-guard.
TODAY’S RANKING OF 15 ETFs (Ranked Daily) ETF ranking follows:
*For additional background on the ETF ranking system see NTSM Page at…
http://navigatethestockmarket.blogspot.com/p/exchange-traded-funds-etf-ranking.html

For more details, see NTSM Page at…
https://navigatethestockmarket.blogspot.com/p/a-system-for-trading-dow-30-stocks-my_8.html
