“Trade what you see; not what you think.” – The Old Fool,
Richard McCranie, trader extraordinaire.
“Far
more money has been lost by investors in preparing for corrections, or
anticipating corrections, than has been lost in the corrections themselves.” -
Peter Lynch, former manager of Fidelity’s Magellan® fund.
“Andy Kessler is spot on with “The New Right Looks Left” (Inside View, July 29). No U.S.
political platform even remotely embodies the Republican principles in which
I’ve believed my entire adult life: small government, fiscal responsibility,
strong defense, free markets. Former President Trump would call me a RINO, but
I think it’s the other way around. After more than 40 years, I have no party.
What’s a voter to do?” - Ann Foster Miller – WSJ letters
My cmt: Truth.
JOBLESS CLAIMS (CNBC)
“Initial claims for unemployment insurance totaled less than expected last week, countering other signs that the labor market is weakening. First-time filings for jobless benefits came to a seasonally adjusted 233,000 for the week, a decline of 17,000 from the previous week’s upwardly revised level and lower than the Dow Jones estimate for 240,000...” Story at...
https://www.cnbc.com/2024/08/08/weekly-jobless-claims-fall-to-233000-less-than-expected-in-a-positive-sign-for-labor-market.html
MARKET REPORT / ANALYSIS
-Thursday the S&P 500 rose about 2.3% to 5319.
-VIX fell about 15% to 23.79.
-The yield on the 10-year Treasury rose to 3.989% (compared to this time, prior trading day).
MY TRADING POSITIONS:
XLK – Holding since the October 2022 lows.
SSO – added 8/8.
UWM – added 7/15.
QLD – added 7/24.
DWCPF - Dow Jones U.S. Completion Total Stock Market (TSM) Index, a broad market index made up of stocks of U.S. companies not included in the S&P 500 Index. – Added 7/29/2024
CURRENT SUMMARY OF APPROXIMATELY 50 INDICATORS:
The Bull/Bear Spread count was 16 Bear-signs and 6-Bull. (The rest are neutral. It is normal to have a lot of neutral indicators since many of those are top or bottom indicators that will signal only at extremes.)

The Bull/Bear, 50-Indicator spread (Bull Indicators minus Bear Indicators) declined from -7 to -10 (10 more Bear indicators than Bull indicators). The 10-dMA ended its decline and was flat, suggesting a bounce higher may be coming soon. The signal tends to lag the actual low.
TODAY’S COMMENT:
The Jobless Claims news was bullish and markets did not disappoint.
Today’s price action
confirms yesterday’s suggestion of a bottom indicated by a successful retest of
the prior low. I say suggestion of a retest since I like to
see a lower-low at a retest. Yesterday’s close was actually slightly higher
than the prior low, but let’s not quibble – it looks like the pullback is over. We could still see another retest of the low,
but I don’t expect it.
Volume was low today and as
a result, you may hear lazy analysts say that this rally is suspect. Ignore
them. Volume is always low after a bottom because many investors often remain
wary.
As of today, the S&P 500 was down 6.1% from its
all-time top and 5.8% above its 200-dMA.
(I had a typo here yesterday – the Index was 3.6% above its 200-dMA, not
33.6%.) The Index is 2.3% below its 50-dMA.
The S&P 500 climbed above its 100d-MA and that was a
resistance point.
LONG-TERM INDICATOR: The Long Term NTSM indicator
remained SELL: VOLUME & VIX are bearish; SENTIMENT & PRICE are neutral.
This indicator can be late – now is the time to buy not sell.
BOTTOM LINE
We got confirmation that the bottom was yesterday – that’s my story and I’m sticking with it.
ETF - MOMENTUM ANALYSIS:
TODAY’S RANKING OF 15 ETFs (Ranked Daily) ETF ranking follows:

The top ranked ETF receives
100%. The rest are then ranked based on their momentum relative to the leading
ETF.
*For additional background on the ETF ranking system see NTSM Page at…
http://navigatethestockmarket.blogspot.com/p/exchange-traded-funds-etf-ranking.html
Utilities are leading moentum due to the flight to safety trade. I think Technology (XLK) is probably the best
ETF to own now based on Thursday’s price action.
DOW STOCKS - TODAY’S MOMENTUM RANKING
OF THE DOW 30 STOCKS (Ranked Daily)
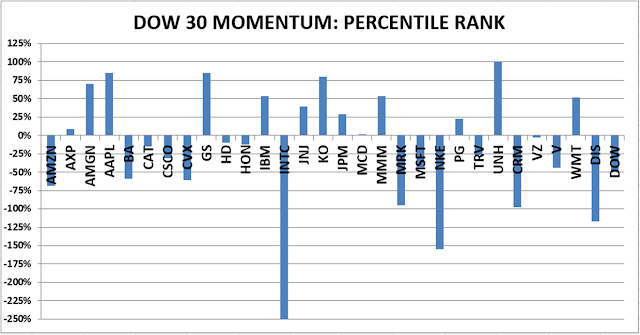
The top ranked Stock receives
100%. The rest are then ranked based on their momentum relative to the leading Stock.
For more details, see NTSM Page at…
https://navigatethestockmarket.blogspot.com/p/a-system-for-trading-dow-30-stocks-my_8.html
THURSDAY MARKET INTERNALS (NYSE
DATA)
 My basket of Market Internals remained HOLD. (My basket of Market
Internals is a decent trend-following analysis of current market action, but
should not be used alone for short term trading. They are most useful when they
diverge from the Index.)
My basket of Market Internals remained HOLD. (My basket of Market
Internals is a decent trend-following analysis of current market action, but
should not be used alone for short term trading. They are most useful when they
diverge from the Index.)
 ...My current invested
position is about 70% stocks, including stock mutual funds and ETFs. I’m
usually about 50% invested in stocks when markets are stretched; my current
stock position is above the norm. (75% is my max stock allocation when I am
strongly bullish.)
...My current invested
position is about 70% stocks, including stock mutual funds and ETFs. I’m
usually about 50% invested in stocks when markets are stretched; my current
stock position is above the norm. (75% is my max stock allocation when I am
strongly bullish.)
I trade about 15-20% of the total portfolio using the
momentum-based analysis I provide here. When I see a definitive bottom, I add a
lot more stocks to the portfolio, usually by using an S&P 500 ETF as I did
back in October 2022 and 2023.
My cmt: Truth.
“Initial claims for unemployment insurance totaled less than expected last week, countering other signs that the labor market is weakening. First-time filings for jobless benefits came to a seasonally adjusted 233,000 for the week, a decline of 17,000 from the previous week’s upwardly revised level and lower than the Dow Jones estimate for 240,000...” Story at...
https://www.cnbc.com/2024/08/08/weekly-jobless-claims-fall-to-233000-less-than-expected-in-a-positive-sign-for-labor-market.html
-Thursday the S&P 500 rose about 2.3% to 5319.
-VIX fell about 15% to 23.79.
-The yield on the 10-year Treasury rose to 3.989% (compared to this time, prior trading day).
XLK – Holding since the October 2022 lows.
SSO – added 8/8.
UWM – added 7/15.
QLD – added 7/24.
DWCPF - Dow Jones U.S. Completion Total Stock Market (TSM) Index, a broad market index made up of stocks of U.S. companies not included in the S&P 500 Index. – Added 7/29/2024
The Bull/Bear Spread count was 16 Bear-signs and 6-Bull. (The rest are neutral. It is normal to have a lot of neutral indicators since many of those are top or bottom indicators that will signal only at extremes.)
The Bull/Bear, 50-Indicator spread (Bull Indicators minus Bear Indicators) declined from -7 to -10 (10 more Bear indicators than Bull indicators). The 10-dMA ended its decline and was flat, suggesting a bounce higher may be coming soon. The signal tends to lag the actual low.
The Jobless Claims news was bullish and markets did not disappoint.
This indicator can be late – now is the time to buy not sell.
We got confirmation that the bottom was yesterday – that’s my story and I’m sticking with it.
TODAY’S RANKING OF 15 ETFs (Ranked Daily) ETF ranking follows:
*For additional background on the ETF ranking system see NTSM Page at…
http://navigatethestockmarket.blogspot.com/p/exchange-traded-funds-etf-ranking.html
For more details, see NTSM Page at…
https://navigatethestockmarket.blogspot.com/p/a-system-for-trading-dow-30-stocks-my_8.html