Payroll Report ... Factory Orders ... Durable Orders ... Momentum Trading DOW Stocks & ETFs … Stock Market Analysis ...
“Trade what you see; not what you think.” – The Old Fool,
Richard McCranie, trader extraordinaire.
“Far
more money has been lost by investors in preparing for corrections, or
anticipating corrections, than has been lost in the corrections themselves.” -
Peter Lynch, former manager of Fidelity’s Magellan® fund.
“Yet again, President Biden took precisely the wrong
position when he bashed Israel for taking out Hamas’ leader, Ismail Haniyeh. Asked
if asked if Haniyeh’s assassination ruined the chances for a cease-fire
agreement in Gaza, the prez said, “It doesn’t help.” Is he for real? Would any
normal American have said taking out Osama bin Laden after 9/11 was
inflammatory and jeopardized peace with al Qaeda?” – NY Post. Story at...
Biden’s
latest idiotic Israel bash is exactly why Iran wants Kamala Harris to beat
Trump (msn.com)
My cmt: Interesting comment by the NY Post. Biden did oppose taking out Osama bin Laden,
but Obama ignored his advce.
PAYROLL REPORT (CNN)
“The US economy added just 114,000 jobs in July, the Bureau of Labor
Statistics reported Friday. That’s significantly worse than predicted, and
underscores recent fears that the job market is slowing too quickly and could
trigger a recession.” Story at...
https://www.cnn.com/business/live-news/us-jobs-report-july-markets/index.html
FACTORY ORDERS (Nasdaq.com via RTT News)
“New orders for U.S. manufactured goods saw a steep drop
in the month of June, according to a report released by the Commerce Department
on Friday.
The report said factory orders plunged by 3.3 percent in
June after falling by 0.5 percent in May.” Story at...
https://www.nasdaq.com/articles/us-factory-orders-plunge-more-expected-june
DURABLE GOODS (Census.gov)
“The final Durable Orders report came in at down 6.6%: “New
orders for manufactured durable goods in June, down following four consecutive
monthly increases, decreased $18.6 billion or 6.6 percent to $264.5 billion,
the U.S. Census Bureau announced today.” Pres release at...
https://www.census.gov/manufacturing/m3/adv/current/index.html
MARKET REPORT / ANALYSIS
-Friday the S&P 500 fell about 1.8% to 5347.
-VIX rose about 26% to 23.39.
-The yield on the 10-year Treasury declined to 3.799%
(compared to this time, prior trading day). The good news of falling rates is
offset by the worry that rates are falling due to fears the economy is
slipping.
MY TRADING POSITIONS:
XLK – Holding since the October 2022 lows.
XLK – added more 7/26. This reestablishes the position I
had before this recent weakness.
UWM – added 7/15.
QLD – added 7/24.
DWCPF - Dow Jones U.S. Completion Total Stock Market
(TSM) Index, a broad market index made up of stocks of U.S. companies not
included in the S&P 500 Index. – Added 7/29/2024
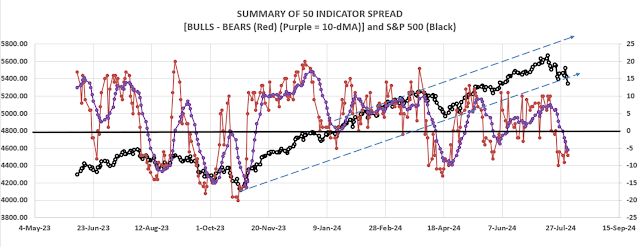
CURRENT SUMMARY OF APPROXIMATELY 50 INDICATORS:
The Bull/Bear Spread count slipped a bit to 15 Bear-signs
and 8-Bull. (The rest are neutral. It is normal to have a lot of neutral
indicators since many of those are top or bottom indicators that will signal
only at extremes.)
The Bull/Bear, 50-Indicator spread (Bull Indicators minus
Bear Indicators) dropped from -6 to -7 (7 more Bear indicators than Bull
indicators).
TODAY’S COMMENT:
Big sell-off Friday with new warnings from indicators and
some positive notes too.
Friday there was a Hindenburg Omen signal. Investopedia
says, “The Hindenburg Omen is a technical
indicator that was designed to signal the increased probability of
a stock market
crash. It compares the percentage of new 52-week highs and new 52-week lows in
stock prices to a predetermined reference percentage that is supposed to
predict the increasing likelihood of a market crash...
The Hindenburg Omen looks for a statistical deviation from the premise that
under normal conditions, some stocks are either making new 52-week highs or new
52-week lows. It would be abnormal if both were occurring at the same time.”
From Investopedia at...
https://www.investopedia.com/terms/h/hindenburgomen.asp
As we’ve noted before, the Omen sends a lot of false
warnings. Along those lines, neither the long-term or short-term Fosback Hi/Low
Logic indicators are bearish. Those
indicators also look at the number of new-highs and new-lows in a somewhat
similar style of analysis as the Hindenburg Omen.
As noted previously, I have been using the 10-dMA of the
50-indicator spread (purple line in the chart above) as a buy-signal. When the
10-dMA is moving higher, it is time to buy. It is still falling, so no
buy-signal yet.
On a more positive note:
Friday, was another statistically significant day, this
time a down-day. That just means that the price-volume move exceeded my
statistical parameters. Statistics show that a statistically-significant, down-day
is followed by an up-day about 60% of the time.
Breadth still looks good.
Even after the selloff today, more than half of all issues on the NYSE
have been up over the last 10-days. Longer time frames look good too.
The 7-Day VIX Rate of Change (ROC) jumped up 29% today. (At
one point, it was up 45%.) As noted by Tom McClellan of McClellan Financial
Publications, "...any reading above around +20% is a pretty good sign of
an oversold bottom for stock prices, one that is worthy of a bounce...”
Bollinger Bands were oversold today. RSI was very close to oversold. Let’s say “close
enough.” These two indicators are
suggesting a bottom.
In addition, there was buying late in the day Friday. If investors
were uniformly negative selling would have carried into the close, so this is
encouraging.
All in all, there are enough encouraging signs to suggest
that if selling does continue it is not likely to fall too much farther.
As of Friday’s close, the S&P 500 has dropped 5.7%
from its all-time high on 16 July. It is now 6.8% above its 200-dMA. It is less
than 1% above its 100-dMA and that is another support level. Looking at the
chart, today’s close is a decent support level going back to May.
Indicators are suggesting a bottom, but signals are not as
strong as we might like. Still, based on indicators, further declines from here
are not likely to exceed 4%.
The average decline of less than 10% takes about 30-days
from top to bottom. This pullback is
17-days as of Friday so we may have more to go before the bottom. It is not a
slam dunk, however; in 2020 there was a 10% correction that was only 14-days
long, top to bottom.
LONG-TERM INDICATOR: The Long Term NTSM indicator declined
to SELL: VOLUME & VIX are bearish; PRICE & SENTIMENT are neutral.
(The Long-Term Indicator is not a good top-indicator. It
can signal BUY at a top.)
(The important major BUY in this indicator was on 21
October 2022, 7-days after the bear-market bottom. For my NTSM overall signal,
I suggested that a short-term buying opportunity occurred on 27 September
(based on improved market internals on the retest), although without market
follow-thru, I was unwilling to call a buy; however, I did close shorts and
increased stock holdings. I issued a Buy-Signal on 4 October, 6-days before the
final bottom, based on stronger market action that confirmed the market
internals signal. The NTSM sell-signal was issued 21 December, 9 sessions
before the high of this recent bear market, based on the bearish “Summary of 50”
indicator.
BOTTOM LINE
I’m waiting to get a buy signal to add more stocks to the
portfolio. I suspect the correction is not over even though there were some
hopeful signs. Volume picked up today
and we’d like to see volume falling to make a meaningful bottom. (I am
wishy-washy here because small corrections give small signals and calling a
bottom on a small pullback is mostly guesswork and/or witchcraft.)
ETF - MOMENTUM ANALYSIS:
TODAY’S RANKING OF 15 ETFs (Ranked Daily) ETF ranking
follows:
The top ranked ETF receives
100%. The rest are then ranked based on their momentum relative to the leading
ETF.
*For additional background on
the ETF ranking system see NTSM Page at…
http://navigatethestockmarket.blogspot.com/p/exchange-traded-funds-etf-ranking.html
DOW STOCKS - TODAY’S MOMENTUM RANKING
OF THE DOW 30 STOCKS (Ranked Daily)
The top ranked Stock receives
100%. The rest are then ranked based on their momentum relative to the leading Stock.
For more details, see NTSM
Page at…
https://navigatethestockmarket.blogspot.com/p/a-system-for-trading-dow-30-stocks-my_8.html
FRIDAY MARKET INTERNALS (NYSE
DATA)
My basket of Market Internals improved but remained HOLD. (My basket of Market
Internals is a decent trend-following analysis of current market action, but
should not be used alone for short term trading. They are most useful when they
diverge from the Index.)
...My current invested
position is about 70% stocks, including stock mutual funds and ETFs. I’m
usually about 50% invested in stocks when markets are stretched; my current
stock position is above the norm. (75% is my max stock allocation when I am
strongly bullish.)
I trade about 15-20% of the total portfolio using the
momentum-based analysis I provide here. When I see a definitive bottom, I add a
lot more stocks to the portfolio, usually by using an S&P 500 ETF as I did
back in October 2022 and 2023.