Monday, November 4, 2024

Momentum Trading DOW Stocks & ETFs … Stock Market Analysis ...

 
“Trade what you see; not what you think.” – The Old Fool, Richard McCranie, trader extraordinaire.
 
“Far more money has been lost by investors in preparing for corrections, or anticipating corrections, than has been lost in the corrections themselves.” - Peter Lynch, former manager of Fidelity’s Magellan® fund.
 
WHAT DOES WARREN BUFET KNOW THAT WE DON’T? (Business Insider via msn)
“Buffett's company grew its mountain of cash, Treasury bills, and other liquid investments to an unprecedented $325 billion between July and September 30, or $310 billion if you subtract nearly $15 billion of payables for Treasury bill purchases. Berkshire's cash pile was below $110 billion two years earlier. The legendary investor and his team sold $36 billion of shares and only made purchases worth $1.5 billion, marking their eighth straight quarter as net sellers.” Story at...
Warren Buffett's Berkshire Hathaway hoarded cash, sold stocks, and halted buybacks ahead of the election
 
MARKET REPORT / ANALYSIS
-Monday the S&P 500 declined about 0.3% to 5713.
-VIX rose about 0.5% to 21.98.  
-The yield on the 10-year Treasury declined (compared to about this time, prior trading day) to 4.301%.
 
MY TRADING POSITIONS:
XLK – Holding since the October 2022 lows.  Added more 9/20.
SSO – added 10/16.
SPY – added 9/19 & more 10/16
 
CURRENT SUMMARY OF APPROXIMATELY 50 INDICATORS:
Today, of the 50-Indicators I track, 16 gave Bear-signs and 5 were Bullish. The rest are neutral. (It is normal to have a lot of neutral indicators since many of the indicators are top or bottom indicators that will signal only at extremes.)

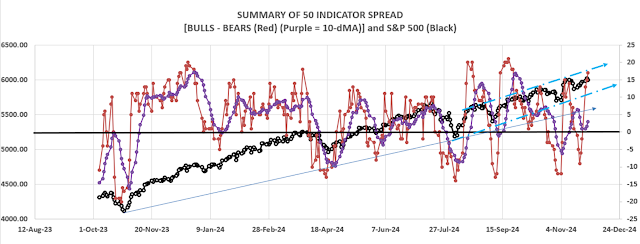
The daily Bull/Bear, 50-Indicator spread (Bull Indicators minus Bear Indicators, red curve in the chart above) improved to -11 (11 more Bear indicators and Bull indicators).
 
TODAY’S COMMENT:
Today’s Bull-Bear spread of -11 is bearish. The 10-dMA of the 50-Indicator Spread (purple line in the chart above) remained bearish since it is still moving lower. (I follow the 10-dMA for trading buy-signals and as an indicator for sell signals.)
 
In addition to the 4 bull signs we saw Friday, a smoothed up-volume indicator has turned bullish and the daily spread improved from -12 to -11.  If we look back at the previous five lows in the above chart, we note that the indicator-spread has bottomed when the S&P 500 bottomed. That would indicate that the pullback is probably over.
 
The S&P 500 closed only slightly higher than its 50-dMA on Thursday and again on Monday; that is more evidence that the weakness is over.
 
The election is weighing on investors.
 
BOTTOM LINE
I’m neutral on the markets, even though the indicators are bearish. Evidence increased that the weakness is finished, or close to finished. I may be adding to stocks Tuesday. It depends on market action.
 
If the daily bull-Bear spread improves I’ll probably increase stock holdings.
 
ETF - MOMENTUM ANALYSIS:
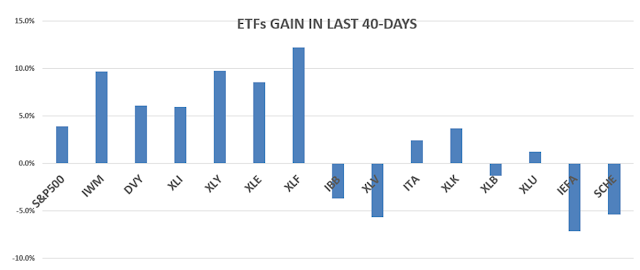
TODAY’S RANKING OF 15 ETFs (Ranked Daily) ETF ranking follows:
 

The top ranked ETF receives 100%. The rest are then ranked based on their momentum relative to the leading ETF.
*For additional background on the ETF ranking system see NTSM Page at…
http://navigatethestockmarket.blogspot.com/p/exchange-traded-funds-etf-ranking.html

DOW STOCKS - TODAY’S MOMENTUM RANKING OF THE DOW 30 STOCKS (Ranked Daily)
 

The top ranked Stock receives 100%. The rest are then ranked based on their momentum relative to the leading Stock.
For more details, see NTSM Page at…
https://navigatethestockmarket.blogspot.com/p/a-system-for-trading-dow-30-stocks-my_8.html

MONDAY MARKET INTERNALS (NYSE DATA)
My basket of Market Internals improved to HOLD.
(My basket of Market Internals is a decent trend-following analysis that is most useful when it diverges from the Index.) 


...My current invested position is about 60% stocks, including stock mutual funds and ETFs. I’m usually about 50% invested in stocks when markets are stretched. (75% is my max stock allocation when I am confident that markets will continue higher.)
 
I trade about 15-20% of the total portfolio using the momentum-based analysis I provide here. When I see bullish signs, I add a lot more stocks to the portfolio, usually by using an S&P 500 ETF as I did back in October 2022 and 2023.
 

Friday, November 1, 2024

Unemployment Rate ... Payroll Report ... ISM Manufacturing ... Construction Spending ... Momentum Trading DOW Stocks & ETFs … Stock Market Analysis ...

 
“Trade what you see; not what you think.” – The Old Fool, Richard McCranie, trader extraordinaire.
 
“Far more money has been lost by investors in preparing for corrections, or anticipating corrections, than has been lost in the corrections themselves.” - Peter Lynch, former manager of Fidelity’s Magellan® fund.
Political commentary from Michael Ramirez at...
https://michaelpramirez.com/index.html#/
 
PAYROLL REPORT / UNEMPLOYMENT RATE (Morningstar)
“The US economy added 12,000 jobs in October, according to the latest report from the Bureau of Labor Statistics... The unemployment rate held steady at 4.1%... The BLS said job growth was likely depressed by the two hurricanes that hit the southeast in October. In addition, strike activity was a detractor.” Story at...
https://www.morningstar.com/economy/october-us-jobs-report-12000-rise-payrolls-likely-depressed-by-hurricanes
 
ISM MANUFACTURING (prnewswire)
"The Manufacturing PMI® registered 46.5 percent in October, 0.7 percentage point lower compared to the 47.2 percent recorded in September. This is the lowest Manufacturing PMI® reading in 2024. The overall economy continued in expansion for the 54th month after one month of contraction in April 2020. (A Manufacturing PMI® above 42.5 percent, over a period of time, generally indicates an expansion of the overall economy.)” Press release at...
https://www.prnewswire.com/news-releases/manufacturing-pmi-at-46-5-october-2024-manufacturing-ism-report-on-business-302293215.html
 
CONSTRUCTION SPENDING (Forest Economic Advisors)
“A closer look at the US Census Bureau’s construction spending report for September, with a focus on residential spending and additional analysis provided by the National Association of Home Builders (NAHB), reveals that private residential construction spending trended up 0.2%. Year-over-year, construction spending was 4.1% higher.” From...
https://getfea.com/end-use/us-private-residential-construction-spending-increases-0-2-in-september
 
MARKET REPORT / ANALYSIS
-Friday the S&P 500 declined about 0.4% to 5729.
-VIX declined about 6% to 21.88.  
-The yield on the 10-year Treasury rose (compared to about this time, prior trading day) to 4.386%.
 
MY TRADING POSITIONS:
XLK – Holding since the October 2022 lows.  Added more 9/20.
SSO – added 10/16.
SPY – added 9/19 & more 10/16
 
CURRENT SUMMARY OF APPROXIMATELY 50 INDICATORS:
Today, of the 50-Indicators I track, 16 gave Bear-signs and 4 were Bullish. The rest are neutral. (It is normal to have a lot of neutral indicators since many of the indicators are top or bottom indicators that will signal only at extremes.)

The daily Bull/Bear, 50-Indicator spread (Bull Indicators minus Bear Indicators, red curve in the chart above) declined to -12 (12 more Bear indicators and Bull indicators).
 
TODAY’S COMMENT:
Today’s Bull-Bear spread of -12 is bearish. The 10-dMA of the 50-Indicator Spread (purple line in the chart above) remained bearish since it is still moving lower. (I follow the 10-dMA for trading buy-signals and as an indicator for sell signals.) There’s worse news – there were only 4 bull indicators.  2 of those are related to breadth.  Breadth has been weak on a shorter 10-day trend, but it has been OK on longer term measures. The other 2 bull signs are: (1) XLU (Utilities) are underperforming the S&P 500 and (2) the statistical-analysis that I mentioned yesterday is suggesting a bottom due to the large down-day at the 50-dMA.
 
There were other bear signs, today there was another Hindenburg Omen (https://www.investopedia.com/terms/h/hindenburgomen.asp). As we’ve noted before, the Omen sends a lot of false warnings.
 
The Fosback New-high/new-low Logic indicator uses a similar analytic approach, but it is closer to buy than sell, so I won’t get too worried about the Hindenburg signal. 
 
I think the biggest worry now is the declining daily, bull-bear spread. We have seen that if the number of Bull-indicators drops to zero, the stock performance that followed has been dismal. On a positive note, the S&P 500 closed only slightly higher than its 50-dMA on Thursday and that may be enough to put an end to the weakness.
 
BOTTOM LINE
As noted yesterday:
I’m neutral on the markets, even though the indicators are bearish. I suspect that the weakness is close to finished. That’s not a well-informed opinion – there’s not much evidence yet, other than the chart and a couple of statistical indicators. We may have to wait until the election is over before the market get’s out of its funk.
 
If the daily bull-Bear spread improves I’ll probably increase stock holdings.
 
ETF - MOMENTUM ANALYSIS:
TODAY’S RANKING OF 15 ETFs (Ranked Daily) ETF ranking follows:
 
 
The top ranked ETF receives 100%. The rest are then ranked based on their momentum relative to the leading ETF.
*For additional background on the ETF ranking system see NTSM Page at…
http://navigatethestockmarket.blogspot.com/p/exchange-traded-funds-etf-ranking.html
 
DOW STOCKS - TODAY’S MOMENTUM RANKING OF THE DOW 30 STOCKS (Ranked Daily)
 

The top ranked Stock receives 100%. The rest are then ranked based on their momentum relative to the leading Stock.
For more details, see NTSM Page at…
https://navigatethestockmarket.blogspot.com/p/a-system-for-trading-dow-30-stocks-my_8.html
 
FRIDAY MARKET INTERNALS (NYSE DATA)
My basket of Market Internals remained SELL.
(My basket of Market Internals is a decent trend-following analysis that is most useful when it diverges from the Index.) 


...My current invested position is about 60% stocks, including stock mutual funds and ETFs. I’m usually about 50% invested in stocks when markets are stretched. (75% is my max stock allocation when I am confident that markets will continue higher.)
 
I trade about 15-20% of the total portfolio using the momentum-based analysis I provide here. When I see bullish signs, I add a lot more stocks to the portfolio, usually by using an S&P 500 ETF as I did back in October 2022 and 2023.