“Trade what you see; not what you think.” – The Old Fool, Richard McCranie, trader extraordinaire.
“The NFIB Small Business Optimism Index rose by 2.2 points in October to 93.7. This is the 34th consecutive month below the 50-year average of 98... “Although optimism is on the rise on Main Street, small business owners are still facing unprecedented economic adversity. Low sales, unfilled jobs openings, and ongoing inflationary pressures continue to challenge our Main Streets, but owners remain hopeful as they head toward the holiday season.” Press release at...
https://www.nfib.com/content/press-release/economy/new-nfib-survey-small-business-optimism-on-the-rise-in-october/
-Tuesday the S&P 500 declined about 0.3% to 5984.
-VIX declined about 2% to 14.71.
-The yield on the 10-year Treasury rose (compared to about this time, prior trading day) to 4.429%.
XLK – Holding since the October 2022 lows. Added more 9/20.
SSO – added 10/16.
SPY – added 9/19 & more 10/16
QLD – added 11/5.
UWM – added 11/11
Today, of the 50-Indicators I track, 6 gave Bear-signs and 14 were Bullish. The rest are neutral. (It is normal to have a lot of neutral indicators since many of the indicators are top or bottom indicators that will signal only at extremes.)
The daily Bull/Bear, 50-Indicator spread (Bull Indicators minus Bear Indicators, red curve in the chart above) declined to +8 (8 more Bull indicators than Bear indicators).
Today’s Bull-Bear spread of +8 is remains bullish – it’s not unusual to see indicators decline on a down-day, so no big deal.
I’m bullish on the markets.
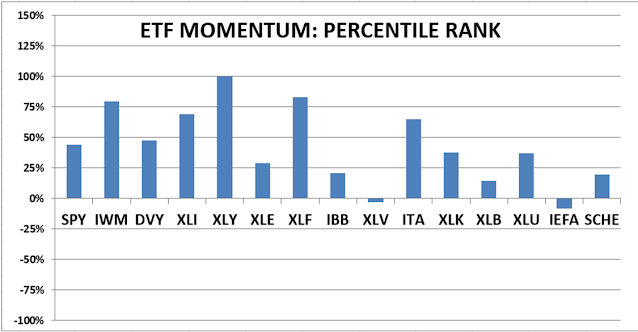
TODAY’S RANKING OF 15 ETFs (Ranked Daily) ETF ranking follows:
*For additional background on the ETF ranking system see NTSM Page at…
http://navigatethestockmarket.blogspot.com/p/exchange-traded-funds-etf-ranking.html
Intel and Dow Inc. have been replaced by Sherwin-Williams and Nvidia Corp. in the Dow Industrials. It will take me a while to make changes to my programming.
For more details, see NTSM Page at…
https://navigatethestockmarket.blogspot.com/p/a-system-for-trading-dow-30-stocks-my_8.html
My basket of Market Internals remained BUY. (My basket of Market Internals is a decent trend-following analysis that is most useful when it diverges from the Index.)


