Monday, December 6, 2021

Coronavirus (Covid-19) … Stock Market Analysis … ETF Trading … Dow 30 Ranking

“Trade what you see; not what you think.” – The Old Fool, Richard McCranie, trader extraordinaire.


"If I was Darth Vader and I wanted to destroy the US economy, I would do aggressive spending in the middle of an already hot economy...This is the biggest bubble I've seen in my career." - Stanley Druckenmiller, billionaire investor.


OMICRON NOT TO BLAME (Heritage Capital)

“...the pullback has little to do with Omicron and more to do with the Fed. In fact, Omicron wasn’t even on my top 10 list. I thought stocks could find a low by 4500 on the S&P 500 which was very close on Thursday. Perhaps, the Fed meeting in 10 days will be the turning point. I still feel very strongly that the low is coming for a powerful rally into January.” – Paul Schatz, Presidengt Heritagae Capital.  Commentary at...

https://investfortomorrow.com/blog/stocks-bounced-and-declined-what-now-omicron-not-to-blame/


WHATS REALLY DRIVING THE OMICRON SELLOFF (RIA)

“While the media is running around trying to pin headlines on the market moves from the Fed to the Omicron variant, the reality is that we are in the midst of mutual fund distribution season. As Michael Lebowitz noted: ‘We believe the rotation is not a sudden change in mindset but, likely the actions of mutual funds rebalancing their portfolios. Frequently at year-end mutual funds sell the winners which have become overweight positions and buy the losers which are below their proper weights. The large returns this year in certain sectors are making these actions more visible than normal.’ There is still some sloppiness likely over the next week, but such should theoretically provide investors the entry point for a “Santa Rally.” – Lance Roberts. Commentary at

https://realinvestmentadvice.com/omicron-selloff-is-it-over-yet/


CORONAVIRUS (NTSM)

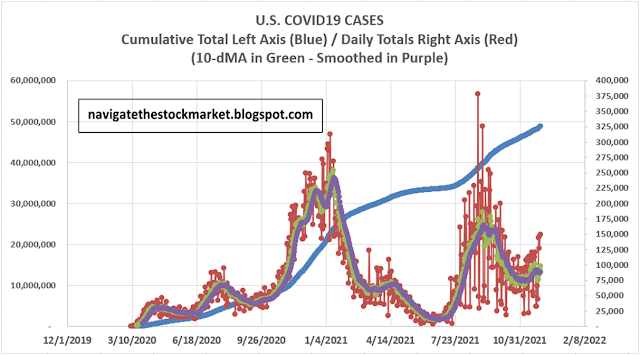
Here’s the latest from the COVID19 Johns Hopkins website as of 10:00 PM Monday. U.S. total case numbers are on the left axis; daily numbers are on the right side of the graph in Red with the 10-dMA of daily numbers in Green. I added the smoothed 10-dMA of new cases (in purple) to the chart.


Today’s big daily number of new cases is mostly due to low reporting over the weekend.  The important point to note is that the moving averages have turned up – not a good sign.


MARKET REPORT / ANALYSIS

-Monday the S&P 500 rose about 1.2% to 4592.

-VIX fell about 11% to 27.25.

-The yield on the 10-year Treasury rose to 1.435%.


While many indicators are pointing down, it’s always a good idea to remember that indicators mostly give us trend direction.  They don’t foretell the future, i.e., the trend may change tomorrow.  The best indicators identify trend changes by determining divergences that can help locate pockets of bullish behavior that can be indicative of a future move in the market as a whole. Those are fancy words to explain that often we don’t know WTF is going on.


As I noted Friday, “We didn’t get a lower-low, so this correction is likely not over. Breadth got worse, further reinforcing that view.” But there were a couple of signs Friday that were hinting at a bottom. Volume was slightly lower Friday when compared to the prior low, suggesting lower selling pressure. We also noted that the index reversed around 3PM Friday and closed higher than the lower quarter of Friday’s range. On the negative side, breadth got worse and new-high/new-low spread didn’t improve much.  This suggests that Friday's late-day action was mostly in large caps.  In corrections, small caps usually lead the recovery so the failure of breadth to improve is an argument against “correction over.” Even so, we can’t ignore today’s action.


Apparently, most investors didn’t agree with my opinion and we see new bull signs today in addition to the obvious bullish move in price for all the indices. One troubling clue today was in Utilities.  They were up 1.5% while the S&P 500 was up 1.2%. If the correction was over, why weren’t they selling utilities? Do the Pros know something I don’t? I am sure they do, but in this case the “what” is not clear.


Smart Money (late-day action, presumably by the Pros) is still headed down and that is bearish. Looking at the chart we see that the Index closed exactly on the upper trend line of the current downturn, so from a chart perspective, we wouldn’t conclude the correction is over, at least not yet.


My Money Trend Indicator moved up and is bullish. Other than that, I didn’t see any bull signs that jumped out to me.


Still, Mr. Market doesn’t read my blog and sometimes pays little attention to my opinions. Given the move today, if we get another strong move higher Tuesday, especially if up-volume is high (>80%), I’d say it’s time to Buy. Otherwise, I plan to wait-and-see a little longer.


The daily sum of 20 Indicators improved from -13 to -10 (a positive number is bullish; negatives are bearish); the 10-day smoothed sum that smooths the daily fluctuations improved from -124 to -122 (These numbers sometimes change after I post the blog based on data that comes in late.) Most of these indicators are short-term so they tend to bounce around a lot.


The Long Term NTSM indicator ensemble remained SELL. VIX & Volume are bearish; Price & Sentiment are Neutral.  This indicator ensemble doesn’t mean much now. I am looking at other indicators for a buy signal.  The Long-Term Ensemble is good on the sell side, but it can be slow to give buy signals.


I am bearish to neutral – let’s see what happens tomorrow.


MOMENTUM ANALYSIS:

TODAY’S RANKING OF 15 ETFs (Ranked Daily)

The top ranked ETF receives 100%. The rest are then ranked based on their momentum relative to the leading

ETF.


*For additional background on the ETF ranking system see NTSM Page at…

http://navigatethestockmarket.blogspot.com/p/exchange-traded-funds-etf-ranking.html


TODAY’S RANKING OF THE DOW 30 STOCKS (Ranked Daily)

Here’s the revised DOW 30 and its momentum analysis. The top ranked stock receives 100%. The rest are then ranked based on their momentum relative to the leading stock.

For more details, see NTSM Page at…

https://navigatethestockmarket.blogspot.com/p/a-system-for-trading-dow-30-stocks-my_8.html

MONDAY MARKET INTERNALS (NYSE DATA)

Market Internals remained HOLD.


Market Internals are a decent trend-following analysis of current market action, but should not be used alone for short term trading. They are usually right, but they are often late.  They are most useful when they diverge from the Index. 


I’ll be a buyer when we can see an end to the current weakness.


My stock-allocation in the portfolio is now about 35% invested in stocks; this is well below my “normal” fully invested stock-allocation of 50%.


You may wish to have a higher or lower % invested in stocks depending on your risk tolerance. 50% is a conservative position that I consider fully invested for most retirees.


As a general rule, some suggest that the % of portfolio invested in the stock market should be one’s age subtracted from 100.  So, a 30-year-old person would have 70% of the portfolio in stocks, stock mutual funds and/or stock ETFs.  That’s ok, but for older investors, I usually don’t recommend keeping less than 50% invested in stocks (as a fully invested position) since most people need some growth in the portfolio to keep up with inflation.


Friday, December 3, 2021

Payroll Report ... Factory Orders ... ISM Non-Manufacturing ... Investors Ditching the Markets … Coronavirus (Covid-19) … Stock Market Analysis … ETF Trading … Dow 30 Ranking

“Trade what you see; not what you think.” – The Old Fool, Richard McCranie, trader extraordinaire.


DUE TO ISSUES WITH BLOGSPOT I CAN'T UPLOAD ANY CHARTS OR PHOTOS.  I'LL TRY AGAIN TOMORROW.


UPDATE: CHARTS HAVE BEEN ADDED.


PAYROLL REPORT / UNEMPLOYMENT RATE (CNBC)

“The U.S. economy created far fewer jobs than expected in November, in a sign that hiring started to slow even ahead of the new Covid threat, the Labor Department reported Friday. Nonfarm payrolls increased by just 210,000 for the month, though the unemployment rate fell sharply to 4.2% from 4.6%...” Story at...

https://www.cnbc.com/2021/12/03/jobs-report-november-2021.html


FACTORY ORDERS (WTVB/Reuters)

“New orders for U.S.-made goods increased more than expected in October and businesses spending on equipment appeared to rebound after declining in the third quarter. The Commerce Department said on Friday that factory orders increased 1.0% in October.” Story at... 

https://wtvbam.com/2021/12/03/u-s-factory-orders-rise-more-than-expected-in-october/


ISM NON-MANUFACTURING INDEX (PRnewswire)

“Economic activity in the services sector grew in November for the 18th month in a row — with the Services PMI® setting a record for the fifth time in 2021 — say the nation's purchasing and supply executives in the latest Services ISM® Report On Business®...According to the Services PMI®, all 18 services industries reported growth...Demand continues to outpace supply that has been impacted by capacity constraints, shortages of labor and materials, and logistical challenges. This has also caused demand-pull inflation that is affecting overall business conditions." Story at...

https://www.prnewswire.com/news-releases/services-pmi-at-69-1-november-2021-services-ism-report-on-business-301436832.html


INVESTORS AROUND THE WORLD ARE DITCHING THE MARKETS (Business Insider)

“Not to alarm you — and please don't call your wealth manager immediately after reading this — but the entire world is going to cash. Bank of America Merrill Lynch (BAML) sent around a report tracking global fund flows, and since the second half of last year, cash has been the most popular asset in the world." 

Commentary and charts at... 

https://www.businessinsider.com/bank-of-america-flow-show-going-to-cash-2016-1


CORONAVIRUS (NTSM)

Here’s the latest from the COVID19 Johns Hopkins website as of 6:00 PM Friday. U.S. total case numbers are on the left axis; daily numbers are on the right side of the graph in Red with the 10-dMA of daily numbers in Green. I added the smoothed 10-dMA of new cases (in purple) to the chart.


I suspect the slight downturn in the chart on the moving averages may be a fakeout that results from weak reporting over the 4 -day Thanksgiving holiday period. We’ll see. It looks like it is starting to move up again.

MARKET REPORT / ANALYSIS

-Friday the S&P 500 fell about 0.8% to 4538.

-VIX rose about 10% to 30.67.

-The yield on the 10-year Treasury slipped to 1.357%.


We didn’t get a lower-low today, so this correction is likely not over. Breadth got worse, further reinforcing that view.


The Friday run-down of some important indicators remained sharply to the bear side (20-bear and 2-bull) and was more bearish than last Friday. These indicators tend to be both long-term and short-term, so they are different than the 20 that I report on daily. Details follow:


BULL SIGNS

-The smoothed advancing volume on the NYSE is rising.

-Overbought/Oversold Index (Advance/Decline Ratio) is oversold.


NEUTRAL

-3.5% of all issues traded on the NYSE made new, 52-week highs when the S&P 500 made a new all-time-high, 18 November. This is close to bearish, but is Neutral. (There is no bullish signal for this indicator.)

-The S&P 500 has had 3 Distribution Days in the last 25-days (including today) – Neutral.

-The S&P 500 is 5.4% above its 200-dMA (Bear indicator is 12%.). This value was 15.9% above the 200-dMA when the 10% correction occurred in Sep 2020.

-Bollinger Bands are close to oversold, but not there yet.

-Breadth on the NYSE compared to the S&P 500 index.

-RSI is close to oversold, but remains neutral.

-The size of up-moves has been smaller than the size of down-moves over the last month, but not enough to send a signal.

-1 December, the 52-week, New-high/new-low ratio improved by 0.28 standard deviations, somewhat bullish, but Neutral.

-There have been 10 up-days over the last 20 sessions – Neutral.

-There have been 4 up-days over the last 10-sessions – Neutral.

-Non-crash Sentiment indicator is very bearish, but not enough to send a bullish signal.

-The Fosback High-Low Logic Index is neutral.


BEAR SIGNS

-There have been 6 Statistically-Significant days (big moves in price-volume) in the last 15-days. This can be a bull or bear. With the index below its 50-dMA, let’s call it bear. Also, the back & forth movement we’ve seen is more indicative of a top than a bottom.

-The 10-dMA % of issues advancing on the NYSE (Breadth) is below 50%.

-The 50-dMA % of issues advancing on the NYSE (Breadth) is above 50%.

-The 100-dMA % of issues advancing on the NYSE (Breadth) is below 50%

-MACD of the percentage of issues advancing on the NYSE (breadth) made a bearish crossover 11 November.

-MACD of S&P 500 price made a bearish crossover, 15 November.

-My Money Trend indicator is falling.

-Long-term new-high/new-lows are falling.

-Short-term new-high/new-low data is falling.

-The Smart Money (late-day action) is headed down. (This indicator is based on the Smart Money Indicator developed by Don Hayes).

-The Calm-before-the-Storm Indicator was warning; now we’ve seen 2 Panic Indicators 26 & 30 November suggesting more downside to come.

-VIX is rising sharply.

-More than 90% of the volume was down-volume on 26 Nov & again on 30 Nov.  While those days didn’t quite meet all of the tests for a bearish, high down-volume day, they were close enough. The 2 high Down-volume days confirm the down-trend. A high up-volume would give us a bullish sign and suggest an end to the correction.

-Cyclical Industrials (XLI-ETF) are under-performing the S&P 500.

-The 5-10-20 Timer System is SELL; the 5-dEMA and 10-dEMA are both BELOW the 20-dEMA.

-McClellan Oscillator.

-Slope of the 40-dMA of New-highs is down. This is one of my favorite trend indicators.

-There were 5 Hindenburg Omen signals 17-24 November.  These won’t be canceled until the McClellan Oscillator turns positive.

-The S&P 500 is under-performing the Utilities ETF (XLU).

-42% of the 15-ETFs that I track have been up over the last 10-days.


On Friday, 21 February, 2 days after the top of the Coronavirus pullback, there were 10 bear-signs and 1 bull-sign. Now there are 20 bear-signs and 2 bull-signs. Last week, there were 16 bear-signs and 4 bull-signs.


The daily sum of 20 Indicators improved from -15 to – 13 (a positive number is bullish; negatives are bearish); the 10-day smoothed sum that smooths the daily fluctuations declined from -119 to -124 (These numbers sometimes change after I post the blog based on data that comes in late.) Most of these indicators are short-term so they tend to bounce around a lot.


The Long Term NTSM indicator ensemble remained SELL. VIX & Volume are bearish; Price & Sentiment are Neutral.  This indicator ensemble doesn’t mean much now. I am looking at other indicators for a buy signal.  The Long-Term Ensemble is good on the sell side, but it can be slow to give buy signals.


I remain bearish – no bottom yet.


MOMENTUM ANALYSIS:

TODAY’S RANKING OF 15 ETFs (Ranked Daily)

The top ranked ETF receives 100%. The rest are then ranked based on their momentum relative to the leading

ETF.


*For additional background on the ETF ranking system see NTSM Page at…

http://navigatethestockmarket.blogspot.com/p/exchange-traded-funds-etf-ranking.html


TODAY’S RANKING OF THE DOW 30 STOCKS (Ranked Daily)

Here’s the revised DOW 30 and its momentum analysis. The top ranked stock receives 100%. The rest are then ranked based on their momentum relative to the leading stock.


For more details, see NTSM Page at…

https://navigatethestockmarket.blogspot.com/p/a-system-for-trading-dow-30-stocks-my_8.html


FRIDAY MARKET INTERNALS (NYSE DATA)

Market Internals remained HOLD.


Market Internals are a decent trend-following analysis of current market action, but should not be used alone for short term trading. They are usually right, but they are often late.  They are most useful when they diverge from the Index. 


I’ll be a buyer when we can see an end to the current weakness.


My stock-allocation in the portfolio is now about 35% invested in stocks; this is well below my “normal” fully invested stock-allocation of 50%.


You may wish to have a higher or lower % invested in stocks depending on your risk tolerance. 50% is a conservative position that I consider fully invested for most retirees.


As a general rule, some suggest that the % of portfolio invested in the stock market should be one’s age subtracted from 100.  So, a 30-year-old person would have 70% of the portfolio in stocks, stock mutual funds and/or stock ETFs.  That’s ok, but for older investors, I usually don’t recommend keeping less than 50% invested in stocks (as a fully invested position) since most people need some growth in the portfolio to keep up with inflation.


Thursday, December 2, 2021

Jobless Claims ... Indicator Predicting 10% Correction ... Is a Crash Like 2000 Possible … Coronavirus (Covid-19) … Stock Market Analysis … ETF Trading … Dow 30 Ranking

“Trade what you see; not what you think.” – The Old Fool, Richard McCranie, trader extraordinaire.


JOBLESS CLAIMS (YahooFinance)

“Weekly jobless claims rose after setting a more than five-decade low last week. Still, however, new claims came in near pre-pandemic levels, highlighting ongoing improvements in the labor market...Initial unemployment claims, week ended November 27: 222,000 vs. 240,000 expected” Story at...

https://finance.yahoo.com/news/jobless-claims-preview-economists-expect-claims-to-rise-by-240000-after-reaching-52-year-low-200027307.html


IS A CRASH LIKE 2000 POSSIBLE? (RIA)

“The benefit of using the ratio price to sales (P/S) versus P/E is that sales, or revenue, are not easy to manipulate by executives...the price to sales ratio (P/S) is now 50% above where it was in 1999...15% of the S&P 500 stocks have a P/S ratio greater than ten. That compares to 8% in 1999.” [Does 10x sales make sense?]

 ‘At 10 times revenues, to give you a 10-year payback, I have to pay you 100% of revenues for 10 straight years in dividends. That assumes I can get that by my shareholders. It assumes I have zero cost of goods sold, which is very hard for a computer company. That assumes zero expenses, which is really hard with 39,000 employees. That assumes I pay no taxes, which is very hard. And that assumes you pay no taxes on your dividends, which is kind of illegal. And that assumes with zero R&D for the next 10 years, I can maintain the current revenue run rate. Now, having done that, would any of you like to buy my stock at $64? Do you realize how ridiculous those basic assumptions are?’” - Scott McNeely, CEO of Sun Microsystems, 1999. Commentary at...

https://realinvestmentadvice.com/is-a-stock-market-crash-like-2000-possible

A good bit of the market is working on “The Greater Fool” theory, i.e., there will always be a bigger fool to buy my stock when I get ready to sell.


INDICATOR THAT PREDICTED THE 1987 CRASH IS FLASHING RED [Now Predicting a 10% Correction]  (msn.com)

“Pursche, of Wealthspire, said the sentiment imbalance may well point to a 10% correction but he didn’t believe the current bull market was close to expiry. The economic backdrop has not yet changed, despite speculation about the threat from the omicron variant of Covid 19. “Sentiment matters greatly in the short term, fundamentals matter much more in the long term,” says. Pursche.” Story at...

A Stock Market Indicator That Predicted the 1987 Crash Is Flashing Red (msn.com)


CORONAVIRUS (NTSM)

Here’s the latest from the COVID19 Johns Hopkins website as of 6:00 PM Thursday. U.S. total case numbers are on the left axis; daily numbers are on the right side of the graph in Red with the 10-dMA of daily numbers in Green. I added the smoothed 10-dMA of new cases (in purple) to the chart.


I have been watching a slight down tick in new cases on the chart.  The problem is that starting with Monday of this week, new-cases have been between 130,000 and 150,000 (today), well above the smoothed 10-dMA. I suspect the downturn may be a fakeout that results from weak reporting over the 4 -day Thanksgiving holiday period. We’ll see.


MARKET REPORT / ANALYSIS

-Thursday the S&P 500 rose about 1.4% to 4577.

-VIX dropped about 11% to 27.73.

-The yield on the 10-year Treasury slipped to 1.431%. (Perhaps the Bond Gurus are not convinced the downturn is over?)


Yesterday, we got lower volume on the NYSE (indicating reduced selling), but internals were little improved so I was not convinced that Wednesday was a bottom. The reversal in price was bearish, too, but after today’s bullish move, maybe we should look again. Was Wednesday the bottom of another quick downturn?


Looking at the market we see some bull signs Thursday:

-The S&P 500 closed 0.7% above its 50-dMA.

-Utilities were strong, but they did underperform the S&P 500.

-Cyclical Industrials outperformed by a lot today.

-83% of volume was up-volume


But a lot of bear signs remain...

-Moving averages of Breadth (issues advancing on the NYSE) remained in bear territory, but these naturally lag.

-The 40-dMA of new-highs is still falling, another lagging indicator.

-New-high/new-low data continues to look very weak.  There were only 9 new-highs today with 175 new-lows.  This didn’t even move my scale for improvement.

-The smart money (late-day action) is still headed down.


The new-high/new-low stats bother more than other indicators.  If Wednesday was a bottom, new-highs/new-lows should have improved more Thursday.


The action today supports a down day tomorrow. Today was another statistically significant up-day. That means that the price-volume move exceeded my statistical parameters. Statistics show that a statistically-significant, up-day is followed by a down-day about 60% of the time. Daily indicators didn’t improve by much either.


The daily sum of 20 Indicators improved from -17 to – 15 (a positive number is bullish; negatives are bearish); the 10-day smoothed sum that smooths the daily fluctuations declined from -113 to -119 (These numbers sometimes change after I post the blog based on data that comes in late.) Most of these indicators are short-term so they tend to bounce around a lot.


The Long Term NTSM indicator ensemble remained SELL. VIX & Volume are bearish; Price & Sentiment are Neutral.


All-in-all, I am not yet convinced that Wednesday was the bottom.  I would change my mind if we see another strong positive move up accompanied by improvements in indicators, especially if we have another high up-volume day with up-volume >80% of total volume.


I remain bearish, but I’ll be checking the data Friday. Friday’s run-down of indicators will be interesting.


MOMENTUM ANALYSIS:

TODAY’S RANKING OF 15 ETFs (Ranked Daily)

The top ranked ETF receives 100%. The rest are then ranked based on their momentum relative to the leading

ETF.


*For additional background on the ETF ranking system see NTSM Page at…

http://navigatethestockmarket.blogspot.com/p/exchange-traded-funds-etf-ranking.html


TODAY’S RANKING OF THE DOW 30 STOCKS (Ranked Daily)

Here’s the revised DOW 30 and its momentum analysis. The top ranked stock receives 100%. The rest are then ranked based on their momentum relative to the leading stock.


For more details, see NTSM Page at…

https://navigatethestockmarket.blogspot.com/p/a-system-for-trading-dow-30-stocks-my_8.html


THURSDAY MARKET INTERNALS (NYSE DATA)

Market Internals improved to HOLD.


Market Internals are a decent trend-following analysis of current market action, but should not be used alone for short term trading. They are usually right, but they are often late.  They are most useful when they diverge from the Index. 


I’ll be a buyer when we can see an end to the current weakness.


My stock-allocation in the portfolio is now about 35% invested in stocks; this is well below my “normal” fully invested stock-allocation of 50%.


You may wish to have a higher or lower % invested in stocks depending on your risk tolerance. 50% is a conservative position that I consider fully invested for most retirees.


As a general rule, some suggest that the % of portfolio invested in the stock market should be one’s age subtracted from 100.  So, a 30-year-old person would have 70% of the portfolio in stocks, stock mutual funds and/or stock ETFs.  That’s ok, but for older investors, I usually don’t recommend keeping less than 50% invested in stocks (as a fully invested position) since most people need some growth in the portfolio to keep up with inflation.

Wednesday, December 1, 2021

FED Beige Book ... ADP Employment ... ISM Manufacturing ... Crude Inventories … Coronavirus (Covid-19) … Stock Market Analysis … ETF Trading … Dow 30 Ranking

“Trade what you see; not what you think.” – The Old Fool, Richard McCranie, trader extraordinaire.

I don't like picking on the President, but really...he cancelled oil leases; stopped the Keystone Pipeline; and then asked OPEC and Russia to increase oil production because gasoline prices are up? Come on man!


He recently reversed direction on the oil leases and the US issued its largest auction for new oil leases in the history of the US – I guess getting reelected is more important than saving the world. -

https://www.bostonglobe.com/2021/11/17/science/biden-administration-hold-largest-oil-gas-sale-us-history/


FED BEIGE BOOK (Fox Business)

“Supply chain bottlenecks and a worsening labor shortage threatened to undermine the U.S. economic recovery from the coronavirus pandemic this fall, according to a new Federal Reserve report...the Fed reported that while economic activity increased at a "modest to moderate pace" in most of its 12 districts during the October through November period that the report covers, growth was hindered by severe disruptions in the global supply chain and a lack of available workers.” Story at...

https://www.foxbusiness.com/economy/supply-chain-bottlenecks-labor-shortage-federal-reserve-beige-book


ADP EMPLOYMENT CHANGE (ADP via PR Newswire)

“Private sector employment increased by 534,000 jobs from October to November according to the November ADP® National Employment ReportTM...’The labor market recovery continued to power through its challenges last month," said Nela Richardson, chief economist, ADP.  "November's job gains bring the three month average to 543,000 monthly jobs added, a modest uptick from the job pace earlier this year. Job gains have eclipsed 15 million since the recovery began, though 5 million jobs short of pre-pandemic levels. Service providers, which are more vulnerable to the pandemic, have dominated job gains this year.’” Press release at... 

https://www.prnewswire.com/news-releases/adp-national-employment-report-private-sector-employment-increased-by-534-000-jobs-in-november-301434969.html


ISM MANUFACTURING (ISM via PR Newswire)

“Economic activity in the manufacturing sector grew in November, with the overall economy achieving an 18th consecutive month of growth, say the nation's supply executives in the latest Manufacturing ISM® Report On Business®..."The November Manufacturing PMI® registered 61.1 percent, an increase of 0.3 percentage point from the October reading of 60.8 percent. This figure indicates expansion in the overall economy for the 18th month in a row after a contraction in April 2020.” Press release at...

https://www.prnewswire.com/news-releases/manufacturing-pmi-at-61-1-november-2021-manufacturing-ism-report-on-business-301433617.html


EIA CRUDE INVENTORIES (EIA)

“U.S. commercial crude oil inventories (excluding those in the Strategic Petroleum Reserve) decreased by 0.9 million barrels from the previous week. At 433.1 million barrels, U.S. crude oil inventories are about 6% below the five year average for this time of year.” Report at...

https://ir.eia.gov/wpsr/wpsrsummary.pdf


CORONAVIRUS (NTSM)

Here’s the latest from the COVID19 Johns Hopkins website as of 6:00 PM Wednesday. U.S. total case numbers are on the left axis; daily numbers are on the right side of the graph in Red with the 10-dMA of daily numbers in Green. I added the smoothed 10-dMA of new cases (in purple) to the chart.


MARKET REPORT / ANALYSIS

-Wednesday the S&P 500 fell about 1.2% to 4513.

-VIX jumped about 14% to 31.12.

-The yield on the 10-year Treasury dropped to 1.408%.


I caught Cramer on CNBC around mid-day as the S&P 500 was peaking. He was bad mouthing the bears and declaring what a gift it was to buy the lows Friday.  I wonder if he feels as confident now? The S&P 500 lost more than 125 points (2%+) after his comments. If you are looking for a bad reversal day, it doesn’t get much worse than today.


Today, we got lower volume on the NYSE (indicating reduced selling), but internals were little improved so today didn’t look like a bottom to me. The reversal in price was bearish, too.


The S&P 500 closed 0.6% below its 50-dMA. That break of the 50-day is likely to bring more selling. The index is down 4.1% below its recent all-time high.


Like yesterday, Bollinger Bands are oversold.  I use this indicator with RSI. RSI is not yet oversold and Bollinger Bands alone don’t mean much. There are no other Bottom Indicators that are bullish.


Today was another statistically significant down-day. That just means that the price-volume move exceeded my statistical parameters. Statistics show that a statistically-significant, down-day is followed by an up-day about 60% of the time.


The daily sum of 20 Indicators remained -17 (a positive number is bullish; negatives are bearish); the 10-day smoothed sum that smooths the daily fluctuations declined from -99 to -113 (These numbers sometimes change after I post the blog based on data that comes in late.) Most of these indicators are short-term so they tend to bounce around a lot.


The Long Term NTSM indicator ensemble remained SELL. Price, VIX & Volume are bearish.  Sentiment is Neutral.


I’ll be working to identify a buying point.  The average correction lasts about a month for corrections less than 10%. I still suspect that this pullback is inflation/FED related rather than Omicron-Covid, but this morning’s bull move seemed to suggest it was all about Omicron. Either way, I don’t expect a quick resolution, but I have been wrong before.


The Index is 5% above its 200-dMA and that is a likely end for this decline.


I remain bearish.


MOMENTUM ANALYSIS:

TODAY’S RANKING OF 15 ETFs (Ranked Daily)

The top ranked ETF receives 100%. The rest are then ranked based on their momentum relative to the leading

ETF.

*For additional background on the ETF ranking system see NTSM Page at…

http://navigatethestockmarket.blogspot.com/p/exchange-traded-funds-etf-ranking.html


TODAY’S RANKING OF THE DOW 30 STOCKS (Ranked Daily)

Here’s the revised DOW 30 and its momentum analysis. The top ranked stock receives 100%. The rest are then ranked based on their momentum relative to the leading stock.

For more details, see NTSM Page at…

https://navigatethestockmarket.blogspot.com/p/a-system-for-trading-dow-30-stocks-my_8.html


WEDNESDAY MARKET INTERNALS (NYSE DATA)

Market Internals remained SELL.


Market Internals are a decent trend-following analysis of current market action, but should not be used alone for short term trading. They are usually right, but they are often late.  They are most useful when they diverge from the Index. 


I’ll be a buyer when we can see an end to the current weakness.


My stock-allocation in the portfolio is now about 35% invested in stocks; this is well below my “normal” fully invested stock-allocation of 50%.


You may wish to have a higher or lower % invested in stocks depending on your risk tolerance. 50% is a conservative position that I consider fully invested for most retirees.


As a general rule, some suggest that the % of portfolio invested in the stock market should be one’s age subtracted from 100.  So, a 30-year-old person would have 70% of the portfolio in stocks, stock mutual funds and/or stock ETFs.  That’s ok, but for older investors, I usually don’t recommend keeping less than 50% invested in stocks (as a fully invested position) since most people need some growth in the portfolio to keep up with inflation.