“Trade what you see; not what you think.” – The Old Fool, Richard McCranie, trader extraordinaire.
“The market seems to have gotten way out in front over this one CPI report. Everybody should just take a deep breath, calm down. We’ve got a ways to go...Rates are going keep going up and they are going to stay high for awhile until we see this inflation get down closer to our target...We’re looking at moving in paces of potentially 50 [basis points] at the next meeting or the next meeting after that...” - Federal Reserve Governor Christopher Waller. Story at...
Fed’s Waller says market has overreacted to consumer inflation data: ‘We’ve got a long, long way to go’ (msn.com)
The Fed needs to talk down the stock & bond market. They want interest rates to remain high. Markets are looking out 6-9 months so it is not really clear whether the markets overreacted.

Note that the spread increased at the retest of the bottom in October when compared to the June lows. In addition, spread continues to improve showing very good outperformance by the S&P 500 when compared to the Utilities ETF, XLU. This indicator suggests the markets can go higher.
-Monday the S&P 500 fell 0.9% to 3957.
-VIX rose about 5% to 23.73.
-The yield on the 10-year Treasury rose to 3.860%.
-Drop from Top: 17.5% as of today. 25.4% max (on a closing basis).
-Trading Days since Top: 218-days.
The S&P 500 is 3% Below its 200-dMA & 4.4% ABOVE its 50-dMA.
*I won’t call the correction over until the S&P 500 makes a new-high; however, evidence suggests the bottom was in the 3600 area and I am fully invested with a higher percentage of stocks than normal.
XLI – Industrial ETF (XLI still looks good to me. Nearly 10% of XLI is in Boeing and Caterpillar and they are both strong performers in the DOW momentum analysis.)
QLD – 2x Nas 100
DDM – 2x Dow 30
XLK – Technology ETF

Oooohhh...another ugly close. A down-day is not a surprise after the strong week we saw last week. Pundits on CNBC were talking about holding the 4000 and that 4000 was strong resistance. There’s a bigger issue looming. Now, it’s probably about upcoming news, because, here we go again...Producer Price Index (PPI) will be released Tuesday at 8:30am. Traders didn’t want to hold long positions going into the release and overall volume was down Monday. The news will effect the markets – good news or bad. I won’t guess, we’ll have to wait and see.
BEST ETFs - MOMENTUM ANALYSIS:
TODAY’S RANKING OF 15 ETFs (Ranked Daily)
ETF ranking follows:
The top ranked ETF receives 100%. The rest are then ranked based on their momentum relative to the leading ETF.

http://navigatethestockmarket.blogspot.com/p/exchange-traded-funds-etf-ranking.html
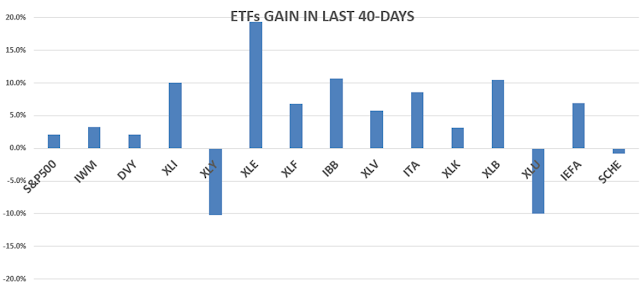
XLE has taken the top position in the ETF momentum index. I own CVX so I already have good exposure to energy.
BEST DOW STOCKS - TODAY’S MOMENTUM RANKING OF THE DOW 30 STOCKS (Ranked Daily)
DOW 30 momentum ranking follows:

For more details, see NTSM Page at…
https://navigatethestockmarket.blogspot.com/p/a-system-for-trading-dow-30-stocks-my_8.html

MONDAY MARKET INTERNALS (NYSE DATA)

(Market Internals are a decent trend-following analysis of current market action, but should not be used alone for short term trading. They are most useful when they diverge from the Index.)