Crude Inventories ... Momentum Trading DOW Stocks & ETFs … Stock Market Analysis ...
“Trade what you see; not what you think.” – The Old Fool,
Richard McCranie, trader extraordinaire.
“Far
more money has been lost by investors in preparing for corrections, or
anticipating corrections, than has been lost in the corrections themselves.” -
Peter Lynch, former manager of Fidelity’s Magellan® fund.
“Since this is an era when many people are concerned
about 'fairness' and 'social justice,' what is your 'fair share' of what
someone else has worked for?” ― Thomas Sowell
CRUDE INVENTORIES (EIA)
“U.S. commercial crude oil inventories (excluding those
in the Strategic Petroleum Reserve) decreased by 1.5 million barrels from the
previous week. At 447.0 million barrels, U.S. crude oil inventories are about
3% below the five-year average for this time of year.” Report at...
https://ir.eia.gov/wpsr/wpsrsummary.pdf
MARKET REPORT / ANALYSIS
-Wednesday the S&P 500 slipped about 0.2% to 5165.
-VIX declined about 0.6% to 13.75.
-The yield on the 10-year Treasury rose to 4.188%.
MY TRADING POSITIONS:
QLD- Added 2/20/2024
UWM – Added 1/22/2024.
XLK – Technology ETF (holding since the October 2022
lows).
INTC – Added 12/6/2023.
CRM – Added 1/22/2024
DWCPF - Dow Jones U.S. Completion Total Stock Market
Index. – Added 12/7/2023 when I sold the S&P 500. This is a large position
in my retirement account betting on Small Caps.
TODAY’S COMMENT:
The Russell 200 (Green) is still underperforming the S&P 500 (Blue) as we see in the chart above. But that wasn’t the case today as the Russell was
up 0.3% while the S&P 500 fell about 0.2%. I think the Russell will catch
up so I am heavily weighted toward small caps in IWM, UWM and DWCPF.
CURRENT SUMMARY OF APPROXIMATELY 50 INDICATORS:
Now there are 8 bear-signs and 17-Bull. Monday,
there were 10 bear-signs and 15 bull-signs. Here are a few of the significant
indicators.
-On the Bull side, Buying-Pressure minus Selling-Pressure
turned up. That’s a good sign. It has been bearish since mid-January.
For the Bears, the market remains stretched to the high
side, but neither of the following signals, by themselves, are enough to get me
to adjust the portfolio:
- The S&P 500 is 13.1% above its 200-dMA. Markets are
getting stretched. (The Bear indicator is 12% above the 200-day.)
- All the ETFs I track were above their respective
200-dMA, today, 3/12/2024. That’s too bullish, so it’s a bearish indicator.
This indicator will be extended for a week.
These indicators suggest we need to be alert to the
possibility that markets could retreat and Friday’s Outside Reversal Day is
concerning, even though it is not always correct.
LONG-TERM INDICATOR: The Long Term NTSM indicator
remained HOLD: PRICE is positive; SENTIMENT, VOLUME & VIX are neutral.
(The Long-Term Indicator is not a good top-indicator. It
can signal BUY at a top.)
(The important major BUY in this indicator was on 21
October 2022, 7-days after the bear-market bottom. For my NTSM overall signal,
I suggested that a short-term buying opportunity occurred on 27 September
(based on improved market internals on the retest), although without market
follow-thru, I was unwilling to call a buy; however, I did close shorts and
increased stock holdings. I issued a Buy-Signal on 4 October, 6-days before the
final bottom, based on stronger market action that confirmed the market
internals signal. The NTSM sell-signal was issued 21 December, 9 sessions
before the high of this recent bear market, based on the bearish “Friday Rundown”
of indicators.)
BOTTOM LINE
I remain cautiously bullish.
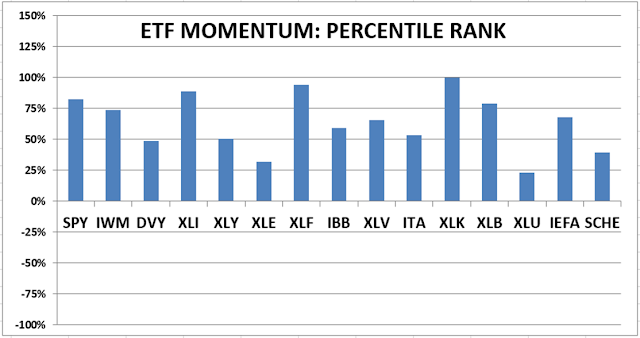
ETF - MOMENTUM ANALYSIS:
TODAY’S RANKING OF 15 ETFs (Ranked Daily) ETF ranking
follows:
The top ranked ETF receives
100%. The rest are then ranked based on their momentum relative to the leading
ETF.
*For additional background on
the ETF ranking system see NTSM Page at…
http://navigatethestockmarket.blogspot.com/p/exchange-traded-funds-etf-ranking.html
DOW STOCKS - TODAY’S MOMENTUM RANKING
OF THE DOW 30 STOCKS (Ranked Daily)
DOW 30 momentum ranking
follows:
The DOW added Amazon to the Dow 30 & Monday I added it to the Momentum
analysis.
The top ranked Stock receives
100%. The rest are then ranked based on their momentum relative to the leading Stock.
For more details, see NTSM
Page at…
https://navigatethestockmarket.blogspot.com/p/a-system-for-trading-dow-30-stocks-my_8.html
WEDNESDAY MARKET INTERNALS
(NYSE DATA)
My basket of Market Internals improved to BUY. (My basket of Market
Internals is a decent trend-following analysis of current market action, but
should not be used alone for short term trading. They are most useful when they
diverge from the Index.)
...My current invested
position is about 70% stocks, including stock mutual funds and ETFs. I’m
usually about 50% invested in stocks. I’m “over invested” now expecting
continuation of bullish market action.
I trade about 15-20% of the total portfolio using the
momentum-based analysis I provide here. When I see a definitive bottom, I add a
lot more stocks to the portfolio using an S&P 500 ETF as I did back in
October.