Jobless Claims ... Momentum Trading DOW Stocks & ETFs … Stock Market Analysis ...
 From Michael Ramirez. Political commentary at...
https://michaelramirez.substack.com/p/michael-ramirez-presidential-portraits?r=ntzh3&utm_campaign=post&utm_medium=web&triedRedirect=true
“Trade what you see; not what you think.” – The Old Fool,
Richard McCranie, trader extraordinaire.
“Far
more money has been lost by investors in preparing for corrections, or
anticipating corrections, than has been lost in the corrections themselves.” -
Peter Lynch, former manager of Fidelity’s Magellan® fund.
“$175,300,000,000,000 is the most important financial
number in the world.
The new Financial
Report of the United States Government (February 2024) estimates
that the financial position of Social Security and Medicare are under
funded by that much. Treasury Secretary Janet Yellin signed the report. The
amount is unfathomable. Here are two examples for context:
-The gross
domestic product of every country on planet earth was only $104.5
trillion last year.
-$175.3 trillion is nearly as
much as our federal government has spent on
everything since the Constitution was written in 1787, even adjusted
for inflation.” From...
https://openthebooks.substack.com/p/the-1753-trillion-doomsday-clock
“Vast swaths of the United States are at risk of running
short of power as electricity-hungry data centers and clean-technology
factories proliferate around the country, leaving utilities and regulators
grasping for credible plans to expand the nation’s creaking power grid.” Story
at...
Amid
explosive demand, America is running out of power (msn.com)
My cmt: Solar and wind won’t make up the difference. Regulatory
issues will make the effort to catch up a big challenge. Politicians are
driving this potential shortage.
JOBLESS CLAIMS (ABC News)
“U.S. applications for jobless benefits were unchanged
last week, settling at a healthy level as the labor market continues to show
strength in the face of elevated interest rates. Unemployment claims for the
week ending March 2 were 217,000, matching the previous week's revised level...”
Story at...
https://abcnews.go.com/Business/wireStory/us-applications-jobless-claims-hold-healthy-levels-107880921
MARKET REPORT / ANALYSIS
-Thursday the S&P 500 rose about 1% to 5157.
-VIX slipped about 0.4% to 14.44.
-The yield on the 10-year Treasury declined to 4.088%.
MY TRADING POSITIONS:
QLD- Added 2/20/2024
UWM – Added 1/22/2024.
XLK – Technology ETF (holding since the October 2022
lows).
INTC – Added 12/6/2023.
CRM – Added 1/22/2024
BA – Added 12/6/2023. I plan to hold Boeing for the time
being, although my patience is running out! Technically, there is a lot of
support around the 200 level. If Boeing
drops below 200 it will be time to bail out.
DWCPF - Dow Jones U.S. Completion Total Stock Market
Index. – Added 12/7/2023 when I sold the S&P 500. This is a large position
in my retirement account betting on Small Caps.
TODAY’S COMMENT:
The Fast Money pundits on CNBC have had a mostly bearish
tone in recent discussions, but they have been wrong – “Buy-the-Dip” is still in
play. Market internals were good today
with advancers 2x decliners and advancing volume also twice declining volume. “This
is not the correction you are looking for. You can go about your business. Move along.”
My bullish indicators are outpacing the bearish ones by a
wide margin. 10.5% of all issues on the NYSE made new-highs today when the
S&P 500 made a new all-time high. Even if there was another pullback, my
work shows that it would be reasonably shallow, less than 10%.
A pullback is still possible. Markets remain
stretched: The S&P 500 remains in
the upper-range of Bollinger Bands, though not overbought yet – same for RSI;
The S&P 500 is 13.4% above its 200-dMA, slightly above the point where we
get a bear signal. (The Bear indicator is 12% above the 200-day.); All the ETFs
I track were still above their respective 200-dMA, today, 3/7/2024. That’s too
bullish, so it’s a bearish indicator. This indicator will be extended for a
week.
These indicators suggest we need to be alert to the
possibility that markets could retreat, but for the time being, I think markets
move higher.
CURRENT SUMMARY OF APPROXIMATELY 50 INDICATORS:
Today, there
were 8 bear-signs and 17-Bull. Wednesday, there were 7
bear-sign and
17 bull-signs.
LONG-TERM INDICATOR: The Long Term NTSM indicator declined
to HOLD: PRICE is positive; SENTIMENT, VOLUME & VIX are neutral.
(The Long-Term Indicator is not a good top-indicator. It
can signal BUY at a top.)
(The important major BUY in this indicator was on 21
October 2022, 7-days after the bear-market bottom. For my NTSM overall signal,
I suggested that a short-term buying opportunity occurred on 27 September
(based on improved market internals on the retest), although without market
follow-thru, I was unwilling to call a buy; however, I did close shorts and
increased stock holdings. I issued a Buy-Signal on 4 October, 6-days before the
final bottom, based on stronger market action that confirmed the market
internals signal. The NTSM sell-signal was issued 21 December, 9 sessions
before the high of this recent bear market, based on the bearish “Friday Rundown”
of indicators.)
BOTTOM LINE
I remain cautiously bullish, but I will take profits in
leveraged positions if topping signals increase, i.e., Bollinger Bands and RSI become overbought..
ETF - MOMENTUM ANALYSIS:
TODAY’S RANKING OF 15 ETFs (Ranked Daily) ETF ranking
follows:

The top ranked ETF receives
100%. The rest are then ranked based on their momentum relative to the leading
ETF.
*For additional background on
the ETF ranking system see NTSM Page at…
http://navigatethestockmarket.blogspot.com/p/exchange-traded-funds-etf-ranking.html
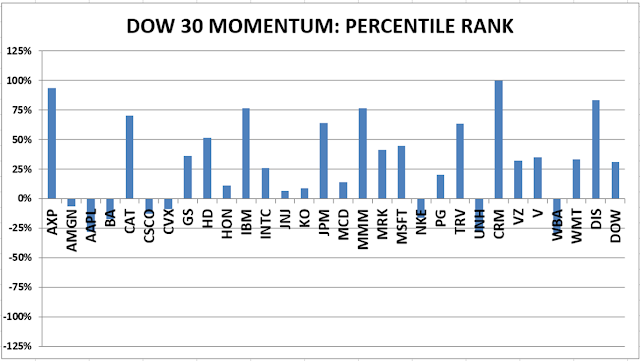
DOW STOCKS - TODAY’S MOMENTUM RANKING
OF THE DOW 30 STOCKS (Ranked Daily)
DOW 30 momentum ranking
follows:
The DOW added Amazon to the Dow 30. I’ll add it, but it’s a time consuming
effort and may take awhile.
The top ranked Stock receives
100%. The rest are then ranked based on their momentum relative to the leading Stock.
For more details, see NTSM
Page at…
https://navigatethestockmarket.blogspot.com/p/a-system-for-trading-dow-30-stocks-my_8.html
THURSDAY MARKET INTERNALS
(NYSE DATA)
My basket of Market Internals improved to BUY. (My basket of Market
Internals is a decent trend-following analysis of current market action, but
should not be used alone for short term trading. They are most useful when they
diverge from the Index.)
...My current invested
position is about 70% stocks, including stock mutual funds and ETFs. I’m
usually about 50% invested in stocks. I’m “over invested” now expecting
continuation of bullish market action.
I trade about 15-20% of the total portfolio using the
momentum-based analysis I provide here. When I see a definitive bottom, I add a
lot more stocks to the portfolio using an S&P 500 ETF as I did back in
October.