
“Super??” Political commentary from Michael Ramirez at...
https://michaelpramirez.com/index.html
https://michaelpramirez.com/index.html
“Trade what you see; not what you think.” – The Old Fool,
Richard McCranie, trader extraordinaire.
“Far
more money has been lost by investors in preparing for corrections, or
anticipating corrections, than has been lost in the corrections themselves.” -
Peter Lynch, former manager of Fidelity’s Magellan® fund.
IN SPITE OF WHAT THE WEATHER GUYS SAID ON NBC AFTER THE RECENT TORNADO OUTBREAK...
"There is no real evidence that tornadoes are
happening more often. A lot more are being recorded now than in 1950, but a
closer look at the data shows the increase is only in the weakest category,
EF0. There's been no increase in stronger twisters, and maybe even a slight
decrease in EF4s and EF5s. That suggests we're just spotting more of the weak
and short-lived tornadoes than we did back when the country was emptier (the
United States population in 1950 was less than half what it is now), we didn't
have Doppler radar, and Oklahoma highways weren't jammed
with storm-chasers.” Story at...
https://www.nationalgeographic.org/article/tornadoes-and-global-warming-there-connection/
My cmt: The science doesn’t support the conclusion that the warming planet is causing more tornadoes...at least not yet. So far, Global Warming does suggest that the tracks of tornados (tornado alley) has shifted somewhat northward.
“Two climate activists have been charged with a felony after they threw red powder onto the display case that holds the United States Constitution.” – From...
Activists Who Vandalized The Constitution With Red Powder Facing Felony Charges (msn.com)
My cmt: Finally! - some tough love for environmental wackos who vandalize national treasures. The Constitution is under glass, but this kind of garbage has got to stop. Burn your copy of the Constitution if you want to make a statement. Vandalize THE Constitution? Go to jail.
TRUMP’S BLOODBATH? (WSJ)
“At an Ohio rally on Friday, Mr. Trump was riffing about the peril facing the U.S auto industry from imports, and along the way he said this: “Now, if I don’t get elected, it’s going to be a bloodbath for the whole—that’s going to be the least of it. It’s going to be a bloodbath for the country.” The press and Democrats jumped on the remarks as if Mr. Trump was inciting violence if he loses. No doubt his words were over the top, as they often are. But his “bloodbath” context was clearly the U.S. car industry, and suggesting more than that plays into Mr. Trump’s hands by giving voters one more reason not to trust media reporting about him.” Opinion at...
https://www.wsj.com/articles/trump-agonistes-blood-bath-and-hostages-chapter-auto-industry-ohio-401bb780?mod=editorials_article_pos2
My cmt: I don’t know who I dislike more: The “media” or Democrats who take every Trump statement out of context. Regular readers know that I despise Trump, but trying to inflame voters by reporting fake news only damages the country.
PRESIDENTIAL CYCLE (McClellan Financial Publications)
“When a first term president is in office and running for reelection, March is typically a sideways month, part of a larger sideways pattern lasting all the way until late May... The stock market normally rallies from June all the way to election day when there is an incumbent running for reelection. And usually an incumbent will win reelection. That is how things normally go.
The [market] veers downward starting in July, reflecting how investors start to feel more nervous about the impending certainty of getting an unknown new president from the November election. Fear of the unknown is the biggest fear for investors... [this cycle] we have an election year completely unlike any previous one. So trying to run a forecast model based on how things have gone in prior election years may just not work this year.” – Tom McClellan. Analysis at...
https://www.mcoscillator.com/learning_center/weekly_chart/election_years_are_different/
“I still think the stock market is in the process of peaking with a pullback coming over the coming few months and a low by Memorial Day.” – Paul Schatz, President heritage Capital.
MARKET REPORT / ANALYSIS
-Monday the S&P 500 rose about 0.6% to 5149.
-VIX rose about 0.1% to 14.33.
-The yield on the 10-year Treasury rose to 4.326%.
MY TRADING POSITIONS:
QLD- Added 2/20/2024
UWM – Added 1/22/2024.
XLK – Technology ETF (holding since the October 2022 lows).
INTC – Added 12/6/2023.
CRM – Added 1/22/2024
DWCPF - Dow Jones U.S. Completion Total Stock Market Index. – Added 12/7/2023 when I sold the S&P 500. This is a large position in my retirement account betting on Small Caps.
TODAY’S COMMENT:
Wash rinse repeat. The S&P 500 tracked back to its lower trendline Friday and even dropped below it depending on what scales are used to draw the charts. It doesn’t matter. The weak hands were washed out again and investors bought the dip, again, Monday. Now we’ll see what the Fed has to say this week. Markets may stall until the Fed announcement, but the Ides of March have passed and it will soon be time for markets to move higher. We’ll find out more after the Fed meeting.
The Russell 2000 (-0.7% today) didn’t like the rise in interest rates today. The theory is that rising interest rates hurt the small caps more than the large caps. The PE for the S&P 500 is 25.8. The PE for the Russell 2000 is 12.8. I’ll stick with the Russell. I still expect it to catch up.
I mentioned that Boeing (BA) had support at 200, but I would sell if it broke support. BA has fallen another 10% since it broke support levels 2 weeks ago.
Indicators were little changed from Friday.
CURRENT SUMMARY OF APPROXIMATELY 50 INDICATORS:
Now there are 10 bear-signs and 14-Bull. Friday, there were 9 bear-signs and 14 bull. Here are a few of the significant indicators.
- The S&P 500 is 12.4% above its 200-dMA. The Bear indicator is 12% above the 200-day so this indicator has moved back into the red (bearish side). No need to get too worked up over this one indicator. It’s the ensemble that counts.
On the BULL side,
-Almost all the Breadth indicators look OK including the MACD of Breadth that turned Bullish Friday. Breadth is a very important indicator.
LONG-TERM INDICATOR: The Long Term NTSM indicator remained HOLD: PRICE is positive; SENTIMENT, VOLUME & VIX are neutral.
(The Long-Term Indicator is not a good top-indicator. It can signal BUY at a top.)
(The important major BUY in this indicator was on 21 October 2022, 7-days after the bear-market bottom. For my NTSM overall signal, I suggested that a short-term buying opportunity occurred on 27 September (based on improved market internals on the retest), although without market follow-thru, I was unwilling to call a buy; however, I did close shorts and increased stock holdings. I issued a Buy-Signal on 4 October, 6-days before the final bottom, based on stronger market action that confirmed the market internals signal. The NTSM sell-signal was issued 21 December, 9 sessions before the high of this recent bear market, based on the bearish “Friday Rundown” of indicators.)
BOTTOM LINE
I remain cautiously bullish, but still watching price action at the lower trend line. The Index is there again.
ETF - MOMENTUM ANALYSIS:
TODAY’S RANKING OF 15 ETFs (Ranked Daily) ETF ranking follows:
 The top ranked ETF receives
100%. The rest are then ranked based on their momentum relative to the leading
ETF.
The top ranked ETF receives
100%. The rest are then ranked based on their momentum relative to the leading
ETF.
*For additional background on the ETF ranking system see NTSM Page at…
http://navigatethestockmarket.blogspot.com/p/exchange-traded-funds-etf-ranking.html
My rules say I am supposed to sell an issue that falls out of the top 3 in Percentile Rank. XLK is in 5th place based on Momentum. That would now mean selling XLK. I will remain patient a little longer. Still, the gain in the last 40-days (below) shows other ETFs with better gains.

DOW 30 momentum ranking follows:
The top ranked Stock receives 100%. The rest are then ranked based on their momentum relative to the leading Stock.
For more details, see NTSM Page at…
https://navigatethestockmarket.blogspot.com/p/a-system-for-trading-dow-30-stocks-my_8.html
I skipped my rules on Intel and it has been a disappointment. Serves me right!

MONDAY MARKET INTERNALS (NYSE
DATA)
 My basket of Market Internals remained HOLD. (My basket of Market
Internals is a decent trend-following analysis of current market action, but
should not be used alone for short term trading. They are most useful when they
diverge from the Index.)
My basket of Market Internals remained HOLD. (My basket of Market
Internals is a decent trend-following analysis of current market action, but
should not be used alone for short term trading. They are most useful when they
diverge from the Index.)
 ...My current invested
position is about 65% stocks, including stock mutual funds and ETFs. I’m
usually about 50% invested in stocks. I’m “over invested” now expecting
continuation of bullish market action.
...My current invested
position is about 65% stocks, including stock mutual funds and ETFs. I’m
usually about 50% invested in stocks. I’m “over invested” now expecting
continuation of bullish market action.
I trade about 15-20% of the total portfolio using the momentum-based analysis I provide here. When I see a definitive bottom, I add a lot more stocks to the portfolio using an S&P 500 ETF as I did back in October.
“Super??” Political commentary from Michael Ramirez at...
https://michaelpramirez.com/index.html
“Trade what you see; not what you think.” – The Old Fool, Richard McCranie, trader extraordinaire.
“Far more money has been lost by investors in preparing for corrections, or anticipating corrections, than has been lost in the corrections themselves.” - Peter Lynch, former manager of Fidelity’s Magellan® fund.
TORNADOES AND GLOBAL WARMING (National Geographic)
“There is no real evidence that tornadoes are happening more often. A lot more are being recorded now than in 1950, but a closer look at the data shows the increase is only in the weakest category, EF0. There's been no increase in stronger twisters, and maybe even a slight decrease in EF4s and EF5s. That suggests we're just spotting more of the weak and short-lived tornadoes than we did back when the country was emptier (the United States population in 1950 was less than half what it is now), we didn't have Doppler radar, and Oklahoma highways weren't jammed with storm-chasers.” Story at...
https://www.nationalgeographic.org/article/tornadoes-and-global-warming-there-connection/
My cmt: The science doesn’t support the conclusion that the warming planet is causing more tornadoes...at least not yet. So far, Global Warming does suggest that the tracks of tornados (tornado alley) has shifted somewhat northward.
“Two climate activists have been charged with a felony after they threw red powder onto the display case that holds the United States Constitution.” – From...
Activists Who Vandalized The Constitution With Red Powder Facing Felony Charges (msn.com)
My cmt: Finally! - some tough love for environmental wackos who vandalize national treasures. The Constitution is under glass, but this kind of crap has got to stop. Burn your copy of the Constitution if you want to make a statement. Vandalize THE Constitution? Go to jail.
TRUMP’S BLOODBATH? (WSJ)
“At an Ohio rally on Friday, Mr. Trump was riffing about the peril facing the U.S auto industry from imports, and along the way he said this: “Now, if I don’t get elected, it’s going to be a bloodbath for the whole—that’s going to be the least of it. It’s going to be a bloodbath for the country.” The press and Democrats jumped on the remarks as if Mr. Trump was inciting violence if he loses. No doubt his words were over the top, as they often are. But his “bloodbath” context was clearly the U.S. car industry, and suggesting more than that plays into Mr. Trump’s hands by giving voters one more reason not to trust media reporting about him.” Opinion at...
https://www.wsj.com/articles/trump-agonistes-blood-bath-and-hostages-chapter-auto-industry-ohio-401bb780?mod=editorials_article_pos2
My cmt: I don’t know who I dislike more: The “media” or Democrats who take every Trump statement out of context. Regular readers know that I despise Trump, but trying to inflame voters by reporting fake news only damages the country.
PRESIDENTIAL CYCLE (McLellan Financial Publications)
“When a first term president is in office and running for reelection, March is typically a sideways month, part of a larger sideways pattern lasting all the way until late May... The stock market normally rallies from June all the way to election day when there is an incumbent running for reelection. And usually an incumbent will win reelection. That is how things normally go.
The [market] veers downward starting in July, reflecting how investors start to feel more nervous about the impending certainty of getting an unknown new president from the November election. Fear of the unknown is the biggest fear for investors... [this cycle] we have an election year completely unlike any previous one. So trying to run a forecast model based on how things have gone in prior election years may just not work this year.” – Tom McClellan. Analysis at...
https://www.mcoscillator.com/learning_center/weekly_chart/election_years_are_different/
“I still think the stock market is in the process of peaking with a pullback coming over the coming few months and a low by Memorial Day.” – Paul Schatz, President heritage Capital.
MARKET REPORT / ANALYSIS
-Monday the S&P 500 rose about 0.6% to 5149.
-VIX rose about 0.1% to 14.33.
-The yield on the 10-year Treasury rose to 4.326%.
MY TRADING POSITIONS:
QLD- Added 2/20/2024
UWM – Added 1/22/2024.
XLK – Technology ETF (holding since the October 2022 lows).
INTC – Added 12/6/2023.
CRM – Added 1/22/2024
DWCPF - Dow Jones U.S. Completion Total Stock Market Index. – Added 12/7/2023 when I sold the S&P 500. This is a large position in my retirement account betting on Small Caps.
TODAY’S COMMENT:
Wash rinse repeat. The S&P 500 tracked back to its lower trendline Friday and even dropped below it depending on what scales are used to draw the charts. It doesn’t matter. The weak hands were washed out again and investors bought the dip, again, Monday. Now we’ll see what the Fed has to say this week. Markets may stall until the Fed announcement, but the Ides of March have passed and it will soon be time for markets to move higher. We’ll find out more after the Fed meeting.
The Russell 2000 (-0.7% today) didn’t like the rise in interest rates today. The theory is that rising interest rates hurt the small caps more than the large caps. The PE for the S&P 500 is 25.8. The PE for the Russell 2000 is 12.8. I’ll stick with the Russell. I still expect it to catch up.
I mentioned that Boeing (BA) had support at 200, but I would sell if it broke support. BA has fallen another 10% since it broke support levels 2 weeks ago.
Indicators were little changed from Friday.
CURRENT SUMMARY OF APPROXIMATELY 50 INDICATORS:
Now there are 10 bear-signs and 14-Bull. Friday, there were 9 bear-signs and 14 bull. Here are a few of the significant indicators.
- The S&P 500 is 12.4% above its 200-dMA. The Bear indicator is 12% above the 200-day so this indicator has moved back into the red (bearish side). No need to get too worked up over this one indicator. It’s the ensemble that counts.
On the BULL side,
-Almost all the Breadth indicators look OK including the MACD of Breadth that turned Bullish Friday. Breadth is a very important indicator.
LONG-TERM INDICATOR: The Long Term NTSM indicator remained HOLD: PRICE is positive; SENTIMENT, VOLUME & VIX are neutral.
(The Long-Term Indicator is not a good top-indicator. It can signal BUY at a top.)
(The important major BUY in this indicator was on 21 October 2022, 7-days after the bear-market bottom. For my NTSM overall signal, I suggested that a short-term buying opportunity occurred on 27 September (based on improved market internals on the retest), although without market follow-thru, I was unwilling to call a buy; however, I did close shorts and increased stock holdings. I issued a Buy-Signal on 4 October, 6-days before the final bottom, based on stronger market action that confirmed the market internals signal. The NTSM sell-signal was issued 21 December, 9 sessions before the high of this recent bear market, based on the bearish “Friday Rundown” of indicators.)
BOTTOM LINE
I remain cautiously bullish, but still watching price action at the lower trend line. The Index is there again.
ETF - MOMENTUM ANALYSIS:
TODAY’S RANKING OF 15 ETFs (Ranked Daily) ETF ranking follows:
The top ranked ETF receives 100%. The rest are then ranked based on their momentum relative to the leading ETF.
*For additional background on the ETF ranking system see NTSM Page at…
http://navigatethestockmarket.blogspot.com/p/exchange-traded-funds-etf-ranking.html
My rules say I am supposed to sell an issue that falls out of the top 3 in Percentile Rank. XLK is in 5th place based on Momentum. That would now mean selling XLK. I will remain patient a little longer. Still, the gain in the last 40-days (below) shows other ETFs with better gains.
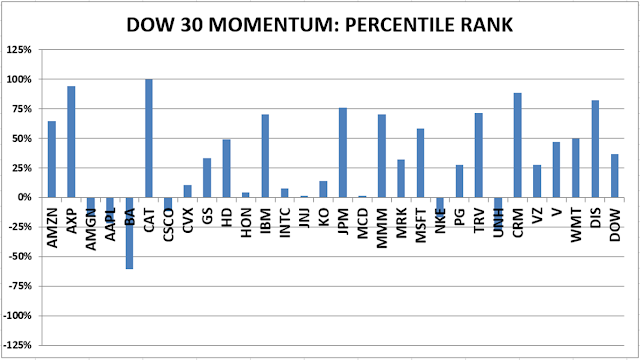
DOW STOCKS - TODAY’S MOMENTUM RANKING OF THE DOW 30 STOCKS (Ranked Daily)
DOW 30 momentum ranking follows:
The DOW added Amazon to the Dow 30 & Monday I added it to the Momentum analysis.
The top ranked Stock receives 100%. The rest are then ranked based on their momentum relative to the leading Stock.
For more details, see NTSM Page at…
https://navigatethestockmarket.blogspot.com/p/a-system-for-trading-dow-30-stocks-my_8.html
I skipped my rules on Intel and it has been a disappointment. Serves me right!
MONDAY MARKET INTERNALS (NYSE DATA)
My basket of Market Internals remained HOLD. (My basket of Market Internals is a decent trend-following analysis of current market action, but should not be used alone for short term trading. They are most useful when they diverge from the Index.)
...My current invested position is about 65% stocks, including stock mutual funds and ETFs. I’m usually about 50% invested in stocks. I’m “over invested” now expecting continuation of bullish market action.
I trade about 15-20% of the total portfolio using the momentum-based analysis I provide here. When I see a definitive bottom, I add a lot more stocks to the portfolio using an S&P 500 ETF as I did back in October.
https://www.nationalgeographic.org/article/tornadoes-and-global-warming-there-connection/
My cmt: The science doesn’t support the conclusion that the warming planet is causing more tornadoes...at least not yet. So far, Global Warming does suggest that the tracks of tornados (tornado alley) has shifted somewhat northward.
“Two climate activists have been charged with a felony after they threw red powder onto the display case that holds the United States Constitution.” – From...
Activists Who Vandalized The Constitution With Red Powder Facing Felony Charges (msn.com)
My cmt: Finally! - some tough love for environmental wackos who vandalize national treasures. The Constitution is under glass, but this kind of garbage has got to stop. Burn your copy of the Constitution if you want to make a statement. Vandalize THE Constitution? Go to jail.
TRUMP’S BLOODBATH? (WSJ)
“At an Ohio rally on Friday, Mr. Trump was riffing about the peril facing the U.S auto industry from imports, and along the way he said this: “Now, if I don’t get elected, it’s going to be a bloodbath for the whole—that’s going to be the least of it. It’s going to be a bloodbath for the country.” The press and Democrats jumped on the remarks as if Mr. Trump was inciting violence if he loses. No doubt his words were over the top, as they often are. But his “bloodbath” context was clearly the U.S. car industry, and suggesting more than that plays into Mr. Trump’s hands by giving voters one more reason not to trust media reporting about him.” Opinion at...
https://www.wsj.com/articles/trump-agonistes-blood-bath-and-hostages-chapter-auto-industry-ohio-401bb780?mod=editorials_article_pos2
My cmt: I don’t know who I dislike more: The “media” or Democrats who take every Trump statement out of context. Regular readers know that I despise Trump, but trying to inflame voters by reporting fake news only damages the country.
PRESIDENTIAL CYCLE (McClellan Financial Publications)
“When a first term president is in office and running for reelection, March is typically a sideways month, part of a larger sideways pattern lasting all the way until late May... The stock market normally rallies from June all the way to election day when there is an incumbent running for reelection. And usually an incumbent will win reelection. That is how things normally go.
The [market] veers downward starting in July, reflecting how investors start to feel more nervous about the impending certainty of getting an unknown new president from the November election. Fear of the unknown is the biggest fear for investors... [this cycle] we have an election year completely unlike any previous one. So trying to run a forecast model based on how things have gone in prior election years may just not work this year.” – Tom McClellan. Analysis at...
https://www.mcoscillator.com/learning_center/weekly_chart/election_years_are_different/
“I still think the stock market is in the process of peaking with a pullback coming over the coming few months and a low by Memorial Day.” – Paul Schatz, President heritage Capital.
MARKET REPORT / ANALYSIS
-Monday the S&P 500 rose about 0.6% to 5149.
-VIX rose about 0.1% to 14.33.
-The yield on the 10-year Treasury rose to 4.326%.
MY TRADING POSITIONS:
QLD- Added 2/20/2024
UWM – Added 1/22/2024.
XLK – Technology ETF (holding since the October 2022 lows).
INTC – Added 12/6/2023.
CRM – Added 1/22/2024
DWCPF - Dow Jones U.S. Completion Total Stock Market Index. – Added 12/7/2023 when I sold the S&P 500. This is a large position in my retirement account betting on Small Caps.
TODAY’S COMMENT:
Wash rinse repeat. The S&P 500 tracked back to its lower trendline Friday and even dropped below it depending on what scales are used to draw the charts. It doesn’t matter. The weak hands were washed out again and investors bought the dip, again, Monday. Now we’ll see what the Fed has to say this week. Markets may stall until the Fed announcement, but the Ides of March have passed and it will soon be time for markets to move higher. We’ll find out more after the Fed meeting.
The Russell 2000 (-0.7% today) didn’t like the rise in interest rates today. The theory is that rising interest rates hurt the small caps more than the large caps. The PE for the S&P 500 is 25.8. The PE for the Russell 2000 is 12.8. I’ll stick with the Russell. I still expect it to catch up.
I mentioned that Boeing (BA) had support at 200, but I would sell if it broke support. BA has fallen another 10% since it broke support levels 2 weeks ago.
Indicators were little changed from Friday.
CURRENT SUMMARY OF APPROXIMATELY 50 INDICATORS:
Now there are 10 bear-signs and 14-Bull. Friday, there were 9 bear-signs and 14 bull. Here are a few of the significant indicators.
- The S&P 500 is 12.4% above its 200-dMA. The Bear indicator is 12% above the 200-day so this indicator has moved back into the red (bearish side). No need to get too worked up over this one indicator. It’s the ensemble that counts.
On the BULL side,
-Almost all the Breadth indicators look OK including the MACD of Breadth that turned Bullish Friday. Breadth is a very important indicator.
LONG-TERM INDICATOR: The Long Term NTSM indicator remained HOLD: PRICE is positive; SENTIMENT, VOLUME & VIX are neutral.
(The Long-Term Indicator is not a good top-indicator. It can signal BUY at a top.)
(The important major BUY in this indicator was on 21 October 2022, 7-days after the bear-market bottom. For my NTSM overall signal, I suggested that a short-term buying opportunity occurred on 27 September (based on improved market internals on the retest), although without market follow-thru, I was unwilling to call a buy; however, I did close shorts and increased stock holdings. I issued a Buy-Signal on 4 October, 6-days before the final bottom, based on stronger market action that confirmed the market internals signal. The NTSM sell-signal was issued 21 December, 9 sessions before the high of this recent bear market, based on the bearish “Friday Rundown” of indicators.)
BOTTOM LINE
I remain cautiously bullish, but still watching price action at the lower trend line. The Index is there again.
ETF - MOMENTUM ANALYSIS:
TODAY’S RANKING OF 15 ETFs (Ranked Daily) ETF ranking follows:
*For additional background on the ETF ranking system see NTSM Page at…
http://navigatethestockmarket.blogspot.com/p/exchange-traded-funds-etf-ranking.html
My rules say I am supposed to sell an issue that falls out of the top 3 in Percentile Rank. XLK is in 5th place based on Momentum. That would now mean selling XLK. I will remain patient a little longer. Still, the gain in the last 40-days (below) shows other ETFs with better gains.
DOW 30 momentum ranking follows:
The top ranked Stock receives 100%. The rest are then ranked based on their momentum relative to the leading Stock.
For more details, see NTSM Page at…
https://navigatethestockmarket.blogspot.com/p/a-system-for-trading-dow-30-stocks-my_8.html
I skipped my rules on Intel and it has been a disappointment. Serves me right!
I trade about 15-20% of the total portfolio using the momentum-based analysis I provide here. When I see a definitive bottom, I add a lot more stocks to the portfolio using an S&P 500 ETF as I did back in October.
“Super??” Political commentary from Michael Ramirez at...
https://michaelpramirez.com/index.html
“Trade what you see; not what you think.” – The Old Fool, Richard McCranie, trader extraordinaire.
“Far more money has been lost by investors in preparing for corrections, or anticipating corrections, than has been lost in the corrections themselves.” - Peter Lynch, former manager of Fidelity’s Magellan® fund.
TORNADOES AND GLOBAL WARMING (National Geographic)
“There is no real evidence that tornadoes are happening more often. A lot more are being recorded now than in 1950, but a closer look at the data shows the increase is only in the weakest category, EF0. There's been no increase in stronger twisters, and maybe even a slight decrease in EF4s and EF5s. That suggests we're just spotting more of the weak and short-lived tornadoes than we did back when the country was emptier (the United States population in 1950 was less than half what it is now), we didn't have Doppler radar, and Oklahoma highways weren't jammed with storm-chasers.” Story at...
https://www.nationalgeographic.org/article/tornadoes-and-global-warming-there-connection/
My cmt: The science doesn’t support the conclusion that the warming planet is causing more tornadoes...at least not yet. So far, Global Warming does suggest that the tracks of tornados (tornado alley) has shifted somewhat northward.
“Two climate activists have been charged with a felony after they threw red powder onto the display case that holds the United States Constitution.” – From...
Activists Who Vandalized The Constitution With Red Powder Facing Felony Charges (msn.com)
My cmt: Finally! - some tough love for environmental wackos who vandalize national treasures. The Constitution is under glass, but this kind of crap has got to stop. Burn your copy of the Constitution if you want to make a statement. Vandalize THE Constitution? Go to jail.
TRUMP’S BLOODBATH? (WSJ)
“At an Ohio rally on Friday, Mr. Trump was riffing about the peril facing the U.S auto industry from imports, and along the way he said this: “Now, if I don’t get elected, it’s going to be a bloodbath for the whole—that’s going to be the least of it. It’s going to be a bloodbath for the country.” The press and Democrats jumped on the remarks as if Mr. Trump was inciting violence if he loses. No doubt his words were over the top, as they often are. But his “bloodbath” context was clearly the U.S. car industry, and suggesting more than that plays into Mr. Trump’s hands by giving voters one more reason not to trust media reporting about him.” Opinion at...
https://www.wsj.com/articles/trump-agonistes-blood-bath-and-hostages-chapter-auto-industry-ohio-401bb780?mod=editorials_article_pos2
My cmt: I don’t know who I dislike more: The “media” or Democrats who take every Trump statement out of context. Regular readers know that I despise Trump, but trying to inflame voters by reporting fake news only damages the country.
PRESIDENTIAL CYCLE (McLellan Financial Publications)
“When a first term president is in office and running for reelection, March is typically a sideways month, part of a larger sideways pattern lasting all the way until late May... The stock market normally rallies from June all the way to election day when there is an incumbent running for reelection. And usually an incumbent will win reelection. That is how things normally go.
The [market] veers downward starting in July, reflecting how investors start to feel more nervous about the impending certainty of getting an unknown new president from the November election. Fear of the unknown is the biggest fear for investors... [this cycle] we have an election year completely unlike any previous one. So trying to run a forecast model based on how things have gone in prior election years may just not work this year.” – Tom McClellan. Analysis at...
https://www.mcoscillator.com/learning_center/weekly_chart/election_years_are_different/
“I still think the stock market is in the process of peaking with a pullback coming over the coming few months and a low by Memorial Day.” – Paul Schatz, President heritage Capital.
MARKET REPORT / ANALYSIS
-Monday the S&P 500 rose about 0.6% to 5149.
-VIX rose about 0.1% to 14.33.
-The yield on the 10-year Treasury rose to 4.326%.
MY TRADING POSITIONS:
QLD- Added 2/20/2024
UWM – Added 1/22/2024.
XLK – Technology ETF (holding since the October 2022 lows).
INTC – Added 12/6/2023.
CRM – Added 1/22/2024
DWCPF - Dow Jones U.S. Completion Total Stock Market Index. – Added 12/7/2023 when I sold the S&P 500. This is a large position in my retirement account betting on Small Caps.
TODAY’S COMMENT:
Wash rinse repeat. The S&P 500 tracked back to its lower trendline Friday and even dropped below it depending on what scales are used to draw the charts. It doesn’t matter. The weak hands were washed out again and investors bought the dip, again, Monday. Now we’ll see what the Fed has to say this week. Markets may stall until the Fed announcement, but the Ides of March have passed and it will soon be time for markets to move higher. We’ll find out more after the Fed meeting.
The Russell 2000 (-0.7% today) didn’t like the rise in interest rates today. The theory is that rising interest rates hurt the small caps more than the large caps. The PE for the S&P 500 is 25.8. The PE for the Russell 2000 is 12.8. I’ll stick with the Russell. I still expect it to catch up.
I mentioned that Boeing (BA) had support at 200, but I would sell if it broke support. BA has fallen another 10% since it broke support levels 2 weeks ago.
Indicators were little changed from Friday.
CURRENT SUMMARY OF APPROXIMATELY 50 INDICATORS:
Now there are 10 bear-signs and 14-Bull. Friday, there were 9 bear-signs and 14 bull. Here are a few of the significant indicators.
- The S&P 500 is 12.4% above its 200-dMA. The Bear indicator is 12% above the 200-day so this indicator has moved back into the red (bearish side). No need to get too worked up over this one indicator. It’s the ensemble that counts.
On the BULL side,
-Almost all the Breadth indicators look OK including the MACD of Breadth that turned Bullish Friday. Breadth is a very important indicator.
LONG-TERM INDICATOR: The Long Term NTSM indicator remained HOLD: PRICE is positive; SENTIMENT, VOLUME & VIX are neutral.
(The Long-Term Indicator is not a good top-indicator. It can signal BUY at a top.)
(The important major BUY in this indicator was on 21 October 2022, 7-days after the bear-market bottom. For my NTSM overall signal, I suggested that a short-term buying opportunity occurred on 27 September (based on improved market internals on the retest), although without market follow-thru, I was unwilling to call a buy; however, I did close shorts and increased stock holdings. I issued a Buy-Signal on 4 October, 6-days before the final bottom, based on stronger market action that confirmed the market internals signal. The NTSM sell-signal was issued 21 December, 9 sessions before the high of this recent bear market, based on the bearish “Friday Rundown” of indicators.)
BOTTOM LINE
I remain cautiously bullish, but still watching price action at the lower trend line. The Index is there again.
ETF - MOMENTUM ANALYSIS:
TODAY’S RANKING OF 15 ETFs (Ranked Daily) ETF ranking follows:
The top ranked ETF receives 100%. The rest are then ranked based on their momentum relative to the leading ETF.
*For additional background on the ETF ranking system see NTSM Page at…
http://navigatethestockmarket.blogspot.com/p/exchange-traded-funds-etf-ranking.html
My rules say I am supposed to sell an issue that falls out of the top 3 in Percentile Rank. XLK is in 5th place based on Momentum. That would now mean selling XLK. I will remain patient a little longer. Still, the gain in the last 40-days (below) shows other ETFs with better gains.
DOW STOCKS - TODAY’S MOMENTUM RANKING OF THE DOW 30 STOCKS (Ranked Daily)
DOW 30 momentum ranking follows:
The DOW added Amazon to the Dow 30 & Monday I added it to the Momentum analysis.
The top ranked Stock receives 100%. The rest are then ranked based on their momentum relative to the leading Stock.
For more details, see NTSM Page at…
https://navigatethestockmarket.blogspot.com/p/a-system-for-trading-dow-30-stocks-my_8.html
I skipped my rules on Intel and it has been a disappointment. Serves me right!
MONDAY MARKET INTERNALS (NYSE DATA)
My basket of Market Internals remained HOLD. (My basket of Market Internals is a decent trend-following analysis of current market action, but should not be used alone for short term trading. They are most useful when they diverge from the Index.)
...My current invested position is about 65% stocks, including stock mutual funds and ETFs. I’m usually about 50% invested in stocks. I’m “over invested” now expecting continuation of bullish market action.
I trade about 15-20% of the total portfolio using the momentum-based analysis I provide here. When I see a definitive bottom, I add a lot more stocks to the portfolio using an S&P 500 ETF as I did back in October.
TORNADOES AND GLOBAL WARMING (National Geographic)