Admiral Motti: "Don't try to frighten us with your
sorcerer’s ways, Lord Vader. Your sad devotion to that ancient religion has not
helped you...”
Is John Hussman Darth Vader??!!
Here’s what John Hussman wrote in today’s commentary: “...we're clearly in better shape than we
were at the peaks of 2007, 2000 and 1929, but conditions are generally more
hostile than they have been in the vast remainder of market history. This will
change. By our analysis, now remains one of the worst times on record to assume
that market risk is acceptable.” From
Hussman Funds at…
Much of Hussman’s discussion has to do with the Shiller
CAPE. More on that later. For now, here’s more on the Shiller CAPE from
Money Magazine this month.
When Robert Shiller did the orginal analysis on the
Cyclically adjusted 10-yr price/earnings ratio (in his words) “…we found a
correlation between that ratio and the next ten-years return.” At today’s CAPE of around 23, the Shiller
research would show an expected annualized return over the next 10-yrs of about
4%.
Here’s a plot of the data showing that relationship. (I got this graphic from Wikipedia and I added
the red line based on the Shiller’s graph published elsewhere. I used this particular chart because the
colors look good.)
http://en.wikipedia.org/wiki/P/E_ratio - Wikipedia originally from
“irrationalexuberance.com/shiller_downloads_data.xls”
Note that there is a lot of scatter. Now there are
mathematical techniques that were undoubtedly used to develop the curve from
the data (actually a straight line in this case), but still, the correlation
doesn’t look strong enough to present future returns to the nearest one-tenth
of one percent return as some do. And
here’s what Mr. Shiller had to say; “A real 4% return seems like a worthwhile
investment. Then again, I don’t know if
I trust that number….Things can go for 200-yrs and then change. I even worry about the 10-yr. P/E – even that
relationship could break down.”
So should we question John Hussman’s strong reliance on
this predictor? It’s not that I don’t
believe there is a relationship – a higher PE clearly suggests a lower return
in the future – but there is a big range in the data. Now if you believe this data, the appropriate
action would be to go to cash immediately.
There aren’t many points to the right of the current PE value. In a nut shell, that’s one big reason why
John Hussman remains negative on the market. But to go a bit further, lets’
look at Hussman’s chart that shows the history of the Shiller CAPE.
If we calculated the CAPE for each market day and then used
the above chart to project future earnings for each day, we could plot the
projected earnings for each market day and compare them to the actual 10-yr
earnings thru 2002. That would give us
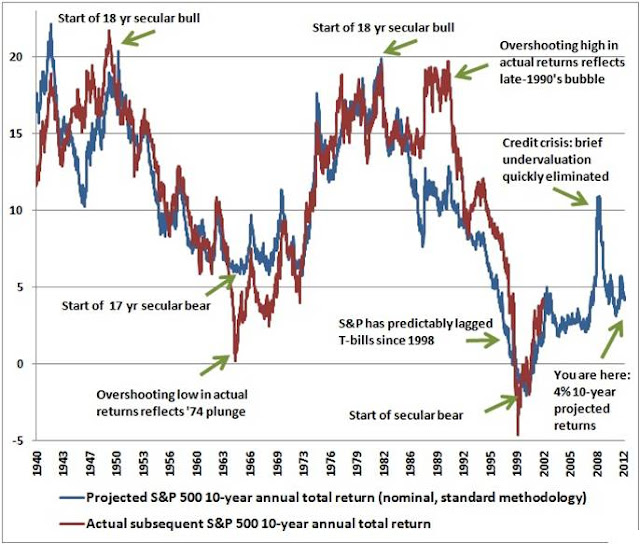
the below chart from Hussman Funds.
The below chart plots the expected 10-yr return based on the
Shiller CAPE analysis in Blue and the actual returns that occurred over the
next 10-yrs in Red.
It shows that the predicted returns have missed the actual
returns by up to 7%. That occurred in
1989 at the start of the dot-com bubble.
Had we relied solely on CAPE in 1989, we would have sold stock and
missed the subsequent 200%-return during the dot-com bubble. (Instead, we might
have made a 100% gain in bonds.) Dot com
bubble aside, the chart looks reasonably predictive and we can see why Hussman
remains negative on the market.
THE MARKET
The S&P 500 was up 3/4% Monday to 1418. VIX closed at 15.6, up nearly 1%.
The S&P 500 is 12% above its 200-dMA.
NTSM
The NTSM analysis remains HOLD Monday.
MY INVESTED POSITION
I bought back into the stock market at S&P 500, 1155
on 7 Oct after the 6 Oct NTSM buy signal.
I remain 100% long in the long-term portfolio (100% stocks in the
401k.). (See the page “How to Use the NTSM System” – the link is on the right
side of this page).

