https://michaelpramirez.com/index.html
...and another poll says two thirds of Americans “won’t or probably won’t” support Trump. That suggests that if the Democrats ran a moderate candidate (say Joe Manchin) they would demolish Trump with a 2 to 1 landslide-victory. Don’t worry, it won’t happen – the Democrats have thrown away moderation and the Republicans have thrown away sanity.
-Friday the S&P 500 rose about 0.1% to 4457.
-VIX dipped about 4% to 13.84.
-The yield on the 10-year Treasury rose to 4.271%.
-Drop from Top: 7.1%. 25.4% max (on a closing basis).
-Trading Days since Top: 420-days.
The S&P 500 is 6.9% ABOVE its 200-dMA and 0.5% BELOW its 50-dMA.
*I won’t call the correction over until the S&P 500 makes a new-high; however, evidence suggests the bottom was in the 3600 area and we called a buy on 4 October 2022.
XLK – Technology ETF (holding since the October lows).
SPY – I bought a large position in the S&P 500 Friday, 8/14, in my 401k (it has limited choices).
XLY - Consumer Discretionary ETF. (Holding since the October lows - I bought more XLY Monday, 8/21.)
XLE – Added Tuesday, 8/22.
SSO – 2x S&P 500 ETF. Added 8/24.
CSCO – added 9/5.
We look at a summary of indicators on Friday: The weekly rundown of indicators made a drastic improvement to the Bull side last week, this week it was less bullish (now 7-bear and 11-bull). I thought the indicators might have moved more to the Bear side so this is good news.
(These indicators tend to be both long-term and short-term, so they are different than the 20 that I report on daily.)
-The 10-dMA percentage of issues advancing on the NYSE (Breadth) is above 50%.
-The 50-dMA percentage of issues advancing on the NYSE (Breadth) is above 50%
-The 100-dMA percentage of issues advancing on the NYSE (Breadth) is above 50%.
-Smoothed Buying Pressure minus Selling Pressure is improving.
-MACD of S&P 500 price made a bullish crossover 29 August.
-Short-term new-high/new-low data.
-On average, the size of up-moves has been larger than the size of down-moves over the last month.
-There were back-to-back 80%+ up-volume days 28 & 29 Aug.
-The 5-10-20 Timer System is BUY.
-The 5-day EMA is above the 10-day EMA, so short-term momentum is bullish.
-56% of the 15-ETFs that I track have been up over the last 10-days. (45-55% is neutral.)
-There were Distribution Days on 5 & 7 Sept. – Not enough to send a signal.
-There have been 3 Statistically-Significant days (big moves in price-volume) in the last 15-days.
-Sentiment.
-Bollinger Band Squeeze 28 April - expired.
-Bollinger Bands.
-The 50-dMA percentage of issues advancing on the NYSE (Breadth) has not been below 50%, for more than 3 days in a row.
-Overbought/Oversold Index (Advance/Decline Ratio).
-Issues advancing on the NYSE (Breadth) compared to the S&P 500.
-10 August there was a Bullish Outside Reversal Day. Expired
-The S&P 500 is 7.2% above its 200-dMA. (Bear indicator is 12% above the 200-day.)
-The long-term, 50-dEMA, Fosback Hi-Low Logic Index.
-There was a Hindenburg Omen signal 6 Aug 2023 – expired. The McClellan Oscillator turned positive.
-The short-term, 10-day EMA, Fosback Hi-Low Logic Index is neutral.
-There have been 6 up-days over the last 10 sessions.
-There have been 9 up-days over the last 20 sessions.
-RSI.
-There was a Zweig Breadth Thrust 31 March. That’s a rare, very-bullish sign, but the McClellan Oscillator subsequently turned negative, so this indicator has expired.
-The Smart Money (late-day action).
-VIX indicator.
-The Calm-before-the-Storm/Panic Indicator flashed a top warning signal 31 July & 1 August. That looks like it was the short-term top; now expired.
-2.8% of all issues traded on the NYSE made new, 52-week highs when the S&P 500 made a new all-time-high, 3 January 2022. (There is no bullish signal for this indicator.) This indicated that the advance was too narrow and a correction was likely to be >10%. It proved correct, but is now Expired.
-XLI-ETF (Cyclical Industrials).
-S&P 500 spread vs. Utilities (XLU-ETF) shows the Index outpacing Utilities, but the spread is fading so call this one neutral.
-MACD of the percentage of issues advancing on the NYSE (breadth) made a bearish crossover 8 September.
-My Money Trend indicator is falling.
-Long-term new-high/new-low data.
-Slope of the 40-dMA of New-highs is falling.
-McClellan Oscillator.
-The graph of the 100-day Count (the 100-day sum of up-days).
-The smoothed advancing volume on the NYSE is falling.
TODAY’S RANKING OF 15 ETFs (Ranked Daily)
ETF ranking follows:

*For additional background on the ETF ranking system see NTSM Page at…
http://navigatethestockmarket.blogspot.com/p/exchange-traded-funds-etf-ranking.html
DOW 30 momentum ranking follows:
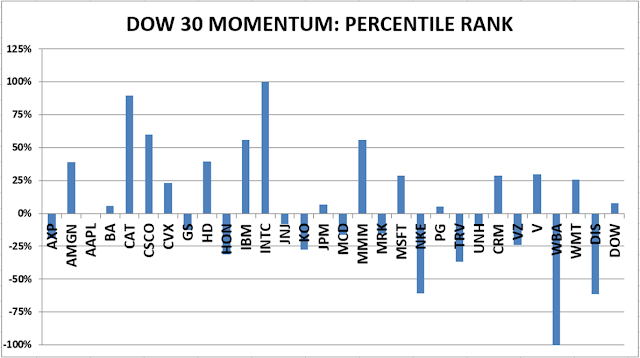
For more details, see NTSM Page at…
https://navigatethestockmarket.blogspot.com/p/a-system-for-trading-dow-30-stocks-my_8.html
