PPI ... Retail Sales ... Jobless Claims ... Momentum Trading DOW Stocks & ETFs … Stock Market Analysis ...
“Trade what you see; not what you think.” – The Old Fool,
Richard McCranie, trader extraordinaire.
"A very large portion of my party really doesn't
believe in the Constitution." – Mitt Romney, Republican Senator from Utah.
"If I was Darth Vader and I wanted to destroy the US
economy, I would do aggressive spending in the middle of an already hot
economy...This is the biggest bubble I've seen in my career." - Stanley
Druckenmiller, billionaire investor. (27 July 2021, back when the CPI was
around 3.0.)
“Nominally, households earned more money in 2022 than
they did in 2021. But thanks to inflation caused
by Bidenomics, real household income (that is, income adjusted for inflation) not only
fell, but fell by an amount not seen since the Great Recession.” –
Washington Examiner. Story at...
Bidenomics
strikes again: Real household income suffers biggest drop since Great Recession
(msn.com)
A PRIMARY DRIVER OF HURRICANE ACTIVITY
“The Atlantic Multi-decadal Oscillation (AMO) has been
identified as a coherent mode of natural variability occurring in the North
Atlantic Ocean with an estimated period of 60-80 years. It is based upon the
average anomalies of sea surface temperatures (SST) in the North Atlantic
basin, typically over 0-80N.” - https://climatedataguide.ucar.edu/domains/atlantic-ocean#:~:text=The%20Atlantic%20Multi%2Ddecadal%20Oscillation,%2C%20typically%20over%200%2D80N.
If you were to plot Hurricane activity on the above
chart, increased hurricane activity tends to occur during the “red” warm
periods. In addition to AMO, the African Saheel is currently undergoing wet
conditions providing fuel for tropical waves leaving Africa and moving toward
the Cape Verde Islands. Curiously, the chart above shows that the current warm
water anomolies in the North Atlantic aren’t that much higher than were
occurring in 1880, long before “global warming.” We’re in an active Hurricane period now, but
the increase is within variability that has occurred in the past and that is
why unbiased experts note: “We look historically. What we’ve observed so far:
There are no long-term trends in hurricanes or more generally tropical
cyclones, as they’re called technically. And I think many people find that as a
surprise. Over the last, roughly almost a century, we see no detectable trends
in hurricanes.” - Steven Koonin, PhD.
https://www.aei.org/economics/what-do-we-know-about-climate-change-my-long-read-qa-with-steven-koonin/
I am not a Global Warming denier. The Earth has warmed about 1 degree
centigrade due to man-made causes, primarily CO2 releases into the atmosphere;
it’s just that the current hysteria over Global Warming is unwarranted.
JOBLESS CLAIMS (Morningstar)
“Worker filings for unemployment benefits rose slightly
last week, but remain low despite a cooling labor market.
Initial claims, a proxy for layoffs, rose by 3,000 in the
week ended Sept. 9 to a seasonally adjusted 220,000...” Story at...
https://www.morningstar.com/news/dow-jones/202309144478/jobless-claims-increased-slightly-last-week-remained-near-historic-lows
PPI (CNBC)
“Inflation at the wholesale level rose more than expected
in August, countering recent data showing that price increases have tempered
lately. The producer price index, a measure of what producers get for their
goods and services, increased a seasonally adjusted 0.7% in August and 1.6% on
a year-over-year basis... excluding food and energy, the PPI climbed 0.2%, in
line with the estimate. On a 12-month basis, core PPI increased 2.1%...” Story
at...
https://www.cnbc.com/2023/09/14/ppi-inflation-report-august-2023-.html
RETAIL SALES (Yahoo Finance)
“August retail sales were stronger than the prior month
as consumers spent more on gas amid a surge in oil
prices. Retail sales rose 0.6% in August from the previous month...”
Story at...
https://finance.yahoo.com/news/retail-sales-pick-up-steam-as-consumers-shell-out-more-for-gas-123621843.html
MARKET REPORT / ANALYSIS
-Thursday the S&P 500 rose about 0.8% to 4505.
-VIX dipped about 5% to 12.81.
-The yield on the 10-year Treasury rose to 4.294%.
PULLBACK DATA:
-Drop from Top: 6.1%. 25.4% max (on a closing basis).
-Trading Days since Top: 426-days.
The S&P 500 is 6.1% ABOVE its 200-dMA and 0.5%
ABOVE its 50-dMA.
*I won’t call the correction over until the S&P 500
makes a new-high; however, evidence suggests the bottom was in the 3600 area
and we called a buy on 4 October 2022.
MY TRADING POSITIONS:
XLK – Technology ETF (holding since the October lows).
SPY – I bought a large position in the S&P 500
Friday, 8/14, in my 401k (it has limited choices).
XLY - Consumer Discretionary ETF. (Holding since the
October lows - I bought more XLY Monday, 8/21.)
XLE – Added Tuesday, 8/22.
SSO – 2x S&P 500 ETF. Added 8/24.
CSCO – added 9/5.
TODAY’S COMMENT:
The S&P 500 bounced above its 50-dMA today. It has
been flipping above and below the 50-day for about a week. Given today’s strong internals, we can feel a
lot better about the markets if the Index can remain above its 50-dMA
tomorrow. We want to see successive days
above the 50-day to suggest a bullish trend change and put this recent market
weakness behind us.
The McClellan Oscillator flipped to the bullish side
today, so that cancels the recent Hindenburg Omens was saw this week. This is
just another reminder why it is important not to follow a single indicator. Ensemble packages of indicators provide a
fuller picture of market action.
Thursday was a statistically significant up-day. That
just means that the price-volume move exceeded my statistical parameters.
Statistics show that a statistically-significant, up-day is followed by a
down-day about 60% of the time.
The daily spread of 20 Indicators (Bulls minus Bears) improved
from -5 to -3 (a positive number is bullish; negatives are bearish); the 10-day
smoothed sum that smooths the daily fluctuations declined from +26 to +9.
(The trend direction is more important than the actual number for the 10-day
value.) These numbers sometimes change after I post the blog based on data that
comes in late. Most of these 20 indicators are short-term so they tend to
bounce around a lot.
LONG-TERM INDICATOR: The Long Term NTSM indicator remains
HOLD: PRICE is Bullish; SENTIMENT, VIX & VOLUME are neutral.
(The important BUY in this indicator was on 21 October,
7-days after the bottom. For my NTSM overall signal, I suggested that a
short-term buying opportunity occurred on 27 September (based on improved
market internals on the retest), although without market follow-thru, I was
unwilling to call a buy; however, I did close shorts and increased stock
holdings. I issued a Buy-Signal on 4 October, 6-days before the final bottom,
based on stronger market action that confirmed the market internals signal. The
NTSM sell-signal was issued 21 December, 9 sessions before the high of this
recent bear market, based on the bearish “Friday Rundown” of indicators.)
Bottom line: I am Bullish.
ETF - MOMENTUM ANALYSIS:
TODAY’S RANKING OF 15 ETFs
(Ranked Daily)
ETF ranking follows:
The top ranked ETF receives
100%. The rest are then ranked based on their momentum relative to the leading
ETF.
*For additional background on
the ETF ranking system see NTSM Page at…
http://navigatethestockmarket.blogspot.com/p/exchange-traded-funds-etf-ranking.html
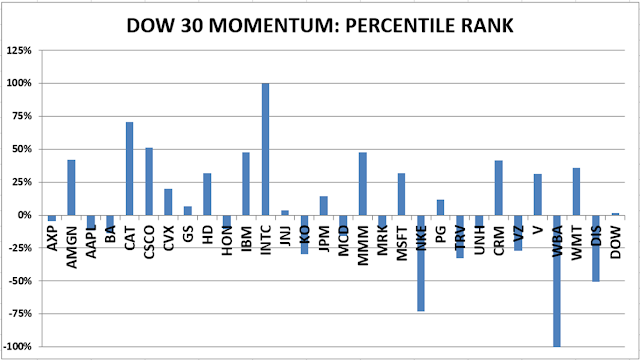
DOW STOCKS - TODAY’S MOMENTUM RANKING
OF THE DOW 30 STOCKS (Ranked Daily)
DOW 30 momentum ranking
follows:
The top ranked Stock receives
100%. The rest are then ranked based on their momentum relative to the leading Stock.
For more details, see NTSM
Page at…
https://navigatethestockmarket.blogspot.com/p/a-system-for-trading-dow-30-stocks-my_8.html
THURSDAY MARKET INTERNALS
(NYSE DATA)
My basket of Market Internals remained SELL. (My basket of Market
Internals is a decent trend-following analysis of current market action, but
should not be used alone for short term trading. They are most useful when they
diverge from the Index.)
...My current invested
position is about 75% stocks, including stock mutual funds and ETFs. I’m
usually about 50% invested in stocks. I’m “over invested” now expecting new,
all-time highs this year. That burns all the cash. I have about 25% of the portfolio in bonds.
I trade about 15-20% of the
total portfolio using the momentum-based analysis I provide here. When I see a
definitive bottom, I add a lot more stocks to the portfolio using an S&P
500 ETF as I did back in October.