“Trade what you see; not what you think.” – The Old Fool, Richard McCranie, trader extraordinaire.
“Labor Department data published Thursday showed another surprise decline in weekly unemployment claims...As Wall Street remains laser-focused on the job market, around 216,000 people filed new applications for the week ended Sept. 2...” Story at...
https://www.thestreet.com/investing/stocks/job-market-back-in-focus-as-wage-pressures-bubble-testing-fed-patience
My cmt: Good news is bad news it seems as markets opened lower this morning.
“Nonfarm business sector labor productivity increased 3.5% in Q2 2023, the U.S. Bureau of Labor Statistics reported...”
https://www.floordaily.net/flooring-news/labor-productivity-rose-35-in-q2
“U.S. commercial crude oil inventories (excluding those in the Strategic Petroleum Reserve) decreased by 6.3 million barrels from the previous week. At 416.6 million barrels, U.S. crude oil inventories are about 4% below the five year average for this time of year.” Report at...
https://ir.eia.gov/wpsr/wpsrsummary.pdf
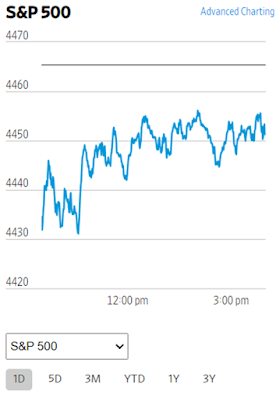
-Thursday the S&P 500 slipped about 0.3% to 4451.
-VIX rose about 0.3% to 14.40.
-The yield on the 10-year Treasury slipped to 4.231%.
-Drop from Top: 7.2%. 25.4% max (on a closing basis).
-Trading Days since Top: 420-days.
The S&P 500 is 6.8% ABOVE its 200-dMA and 0.6% BELOW its 50-dMA.
*I won’t call the correction over until the S&P 500 makes a new-high; however, evidence suggests the bottom was in the 3600 area and we called a buy on 4 October 2022.
XLK – Technology ETF (holding since the October lows).
SPY – I bought a large position in the S&P 500 Friday, 8/14, in my 401k (it has limited choices).
XLY - Consumer Discretionary ETF. (Holding since the October lows - I bought more XLY Monday, 8/21.)
XLE – Added Tuesday, 8/22.
SSO – 2x S&P 500 ETF. Added 8/24.
CSCO – added 9/5.
LONG-TERM INDICATOR: The Long Term NTSM indicator remains
HOLD: PRICE is Bullish; SENTIMENT, VIX & VOLUME are neutral.
(The important BUY in this indicator was on 21 October,
7-days after the bottom. For my NTSM overall signal, I suggested that a
short-term buying opportunity occurred on 27 September (based on improved
market internals on the retest), although without market follow-thru, I was
unwilling to call a buy; however, I did close shorts and increased stock
holdings. I issued a Buy-Signal on 4 October, 6-days before the final bottom,
based on stronger market action that confirmed the market internals signal. The
NTSM sell-signal was issued 21 December, 9 sessions before the high of this
recent bear market, based on the bearish “Friday Rundown” of indicators.)
Bottom line:, I remain Bullish.
ETF - MOMENTUM ANALYSIS:
TODAY’S RANKING OF 15 ETFs (Ranked Daily)
ETF ranking follows:

The top ranked ETF receives
100%. The rest are then ranked based on their momentum relative to the leading
ETF.
*For additional background on the ETF ranking system see NTSM Page at…
http://navigatethestockmarket.blogspot.com/p/exchange-traded-funds-etf-ranking.html
DOW STOCKS - TODAY’S MOMENTUM RANKING
OF THE DOW 30 STOCKS (Ranked Daily)
DOW 30 momentum ranking follows:

The top ranked Stock receives
100%. The rest are then ranked based on their momentum relative to the leading Stock.
For more details, see NTSM Page at…
https://navigatethestockmarket.blogspot.com/p/a-system-for-trading-dow-30-stocks-my_8.html
THURSDAY MARKET INTERNALS
(NYSE DATA)
 My basket of Market Internals remained HOLD. (My basket of Market
Internals is a decent trend-following analysis of current market action, but
should not be used alone for short term trading. They are most useful when they
diverge from the Index.)
My basket of Market Internals remained HOLD. (My basket of Market
Internals is a decent trend-following analysis of current market action, but
should not be used alone for short term trading. They are most useful when they
diverge from the Index.)
TODAY’S RANKING OF 15 ETFs (Ranked Daily)
ETF ranking follows:
*For additional background on the ETF ranking system see NTSM Page at…
http://navigatethestockmarket.blogspot.com/p/exchange-traded-funds-etf-ranking.html
DOW 30 momentum ranking follows:
For more details, see NTSM Page at…
https://navigatethestockmarket.blogspot.com/p/a-system-for-trading-dow-30-stocks-my_8.html