
https://michaelramirez.substack.com/p/michael-ramirez-a-hobsons-choice?r=ntzh3&utm_campaign=post&utm_medium=web
https://www.cnbc.com/2023/09/21/states-push-to-get-to-20-million-installed-heat-pumps-by-2030.html
My cmt: There’s only one problem. Heat pumps don’t work when the temperature falls below freezing. Then, they default to expensive electric, strip heaters. That is why heat pumps are currently used mainly in the South. Further, they are refrigerators in reverse with a compressor that will last about 10 years. Replacement costs are now about $3,000 - $5,000. A gas furnace should last 2 times as long (or more) and cost half as much. We are destroying our economy while China and India laugh at us. As we’ve noted before, “the US is only 13 percent of global emissions. And even if we went to zero, it would be wiped out by the growth in the rest of the world within a decade.” - Steven Koonin, PhD.
My cmt: There might be more than one class, but more than one economy?
“US businesses signalled a broad stagnation in output at the end of the third quarter as manufacturers and service providers alike indicated muted demand conditions. September data indicated the worst performance across the private sector since February, as the service economy lost further momentum...The headline S&P Global Flash US PMI Composite Output Index posted 50.1 in September, down fractionally from 50.2 in August...” Press release at...
https://www.pmi.spglobal.com/Public/Home/PressRelease/f0feaa29fe31498e87438dd193858ad7
-Friday the S&P 500 fell about 0.2% to 4320.
-VIX fell about 2% to 17.20.
-The yield on the 10-year Treasury dipped to 4.440%.
-Drop from Top: 9.9%. 25.4% max (on a closing basis).
-Trading Days since Top: 432-days.
The S&P 500 is 3.1% ABOVE its 200-dMA and 3.5% BELOW its 50-dMA.
*I won’t call the correction over until the S&P 500 makes a new-high; however, evidence suggests the bottom was in the 3600 area and we called a buy on 4 October 2022.
XLK – Technology ETF (holding since the October 2022 lows).
XLY - Consumer Discretionary ETF. (Holding since the October 2022 lows - I bought more XLY Monday, 8/21.)
I took profits and then reestablished positions as follows:
SPY – I bought a large position in the S&P 500 Friday, 8/14, in my 401k (it has limited choices).
XLE – Added Tuesday, 8/22.
SSO – 2x S&P 500 ETF. Added 8/24.
CSCO – added 9/5.
Today, the 7-day rate of change for VIX jumped up to 28. According to Tom McClellan (McClellan Financial Publications) a number around +20 is associated with an “oversold bottom that is worthy of a bounce”. I don’t use this in my system since I have a different way of looking at VIX, but going back to December, numbers above 20 did call the bottom in March. In August, the signal was early. For now, its just another bottoming sign that looks more credible today than it did Thursday. RSI and Bollinger Bands, both Bottom Signals, are oversold thus signaling a likely bottom.
As noted yesterday, today looks like a bottom, but I’d be much more confident if the indicators were stronger, i.e., we could use some more bottom signs. Still, given the bottom indicators we do have, it is likely that the markets are close to a bottom if they haven’t already bottomed. We may have to wait until turn-around Tuesday.
-The 100-dMA percentage of issues advancing on the NYSE (Breadth) is above 50%.
-Bollinger Bands.
-RSI.
-XLI-ETF (Cyclical Industrials) vs the S&P 500.
-There 3 Distribution Days since 15 Sept. – Not enough to send a message.
-There have been 3 Statistically-Significant days (big moves in price-volume) in the last 15-days.
-Sentiment.
-Bollinger Band Squeeze 28 April - expired.
-Overbought/Oversold Index (Advance/Decline Ratio).
-Issues advancing on the NYSE (Breadth) compared to the S&P 500.
-10 August there was a Bullish Outside Reversal Day. Expired
-The S&P 500 is 3.1% above its 200-dMA. (Bear indicator is 12% above the 200-day.)
-The short-term, 10-day EMA, Fosback Hi-Low Logic Index.
-The long-term, 50-dEMA, Fosback Hi-Low Logic Index.
-There were Hindenburg Omen signals 11 & 12 Sept 2023 – expired. The McClellan Oscillator turned positive.
-There have been 4 up-days over the last 10 sessions.
-There have been 10 up-days over the last 20 sessions.
-There was a Zweig Breadth Thrust 31 March. That’s a rare, very-bullish sign, but the McClellan Oscillator subsequently turned negative, so this indicator has expired.
-The Calm-before-the-Storm/Panic Indicator flashed a top warning signal 15 Sept., but it may well have been a bottom signal. But the signal is partly due to volume from Options expiration. Call it neutral.
-The Smart Money (late-day action).
-On average, the size of up-moves has been smaller than the size of down-moves over the last month, but not enough to send a message.
-VIX indicator.
-There was a 90% down-volume days 21 Sept, but only 1 so far.
-2.8% of all issues traded on the NYSE made new, 52-week highs when the S&P 500 made a new all-time-high, 3 January 2022. (There is no bullish signal for this indicator.) This indicated that the advance was too narrow and a correction was likely to be >10%. It proved correct, but is now Expired.
-The graph of the 100-day Count (the 100-day sum of up-days).
-S&P 500 spread vs. Utilities (XLU-ETF) shows the Index outpacing Utilities, but not by much. – Call it neutral.
-The smoothed advancing volume on the NYSE is falling.
-The 10-dMA percentage of issues advancing on the NYSE (Breadth) is below 50%.
-The 50-dMA percentage of issues advancing on the NYSE (Breadth) is above 50%
-The 50-dMA percentage of issues advancing on the NYSE (Breadth) has been below 50%, for more than 3 days in a row.
-MACD of the percentage of issues advancing on the NYSE (breadth) made a bearish crossover 8 September.
-Smoothed Buying Pressure minus Selling Pressure.
-MACD of S&P 500 price made a bearish crossover 18 Sept.
-My Money Trend indicator is falling.
-Short-term new-high/new-low data.
-Long-term new-high/new-low data.
-Slope of the 40-dMA of New-highs is falling.
-McClellan Oscillator.
-The 5-10-20 Timer System is SELL.
-The 5-day EMA is below the 10-day EMA, so short-term momentum is bearish.
-35% of the 15-ETFs that I track have been up over the last 10-days. (45-55% is neutral.)
TODAY’S RANKING OF 15 ETFs (Ranked Daily)
ETF ranking follows:

*For additional background on the ETF ranking system see NTSM Page at…
http://navigatethestockmarket.blogspot.com/p/exchange-traded-funds-etf-ranking.html
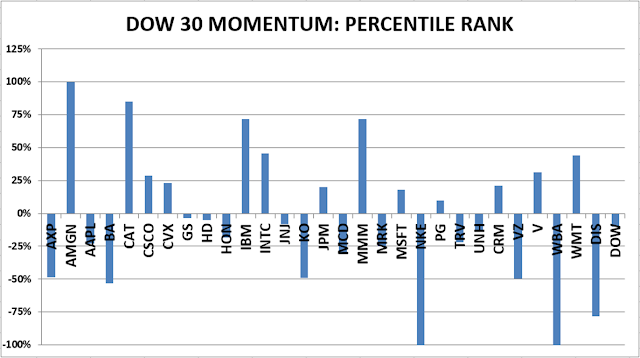
DOW 30 momentum ranking follows:
For more details, see NTSM Page at…
https://navigatethestockmarket.blogspot.com/p/a-system-for-trading-dow-30-stocks-my_8.html
