“Trade what you see; not what you think.” – The Old Fool, Richard McCranie, trader extraordinaire.
...the White House is now actively involved in pushing narratives and denying factual allegations linked to the Biden corruption scandal. That could create Nixonian-type allegations of the abuse of office in the use of federal employees to counter impeachment efforts...
...what is most disturbing is that the White House shows no reluctance or concern in making such an open pitch to the press. There is a sense of license in using the media as an extension of the White House press push. The fact that this is a representative of the White House counsel’s office is particularly chilling. This is not the press office but the counsel for the President calling on media to form a unified front against the Republicans and the impeachment inquiry.” – Jonathan Turley. Turley holds the Shapiro Chair for Public Interest Law at The George Washington University Law School, where he teaches torts, criminal procedure, and constitutional law. Commentary at...
https://jonathanturley.org/2023/09/13/marching-orders-white-house-letter-tells-media-to-ramp-up-their-scrutiny-in-response-to-impeachment-inquiry/#more-209577
“Business activity was little changed in New York State, according to firms responding to the September 2023 Empire State Manufacturing Survey. The headline general business conditions index rose twentyone points to 1.9.” Info at...
https://www.forexfactory.com/news/1241552-empire-state-manufacturing-survey
“U.S. industrial production came in hot in August, with gains in mining output and defense production contributing to an upside surprise. The index for industrial production rose by 0.4 percent in August...” Story at...
https://thehill.com/business/4206615-industrial-production-exceeds-august-expectations/
“Consumer sentiment inched down a scant 1.8 index points this month and has been essentially flat for the past two months. At 67.7 points, sentiment is currently about 35% above the all-time historic low reached in June of 2022 but remains shy of the historical average reading of 86.” Press release at...
http://www.sca.isr.umich.edu/
“Markets are in a soft spot and the UAW strike in the auto industry won’t make things easier. I am still looking for new 2023 highs in Q4 with a shot at all-time highs in Q1. It’s a good time to take stock of your portfolio and make sure you are comfortable with what you own as well as have a shopping list.” Commentary at...
https://investfortomorrow.com/blog/risk-increasing-important-time-to-pay-attention/
-Friday the S&P 500 fell about 1.2% to 4450.
-VIX rose about 8% to 12.81. (Kind of low for the big down-day on the Index.)
-The yield on the 10-year Treasury rose to 4.331%.
-Drop from Top: 6.4%. 25.4% max (on a closing basis).
-Trading Days since Top: 427-days.
The S&P 500 is 6.4% ABOVE its 200-dMA and 0.7% BELOW its 50-dMA.
*I won’t call the correction over until the S&P 500 makes a new-high; however, evidence suggests the bottom was in the 3600 area and we called a buy on 4 October 2022.
XLK – Technology ETF (holding since the October lows).
SPY – I bought a large position in the S&P 500 Friday, 8/14, in my 401k (it has limited choices).
XLY - Consumer Discretionary ETF. (Holding since the October lows - I bought more XLY Monday, 8/21.)
XLE – Added Tuesday, 8/22.
SSO – 2x S&P 500 ETF. Added 8/24.
CSCO – added 9/5.
The Index closed below its 50-dMA so we didn’t get the bull sign we had hoped for. Today’s close was on the lower trendline going back to early March of this year, so that is a bit of support, suggesting a possible bounce next week.
-The 50-dMA percentage of issues advancing on the NYSE (Breadth) is above 50%
-The 100-dMA percentage of issues advancing on the NYSE (Breadth) is above 50%.
-MACD of S&P 500 price made a bullish crossover 29 August.
-The Smart Money (late-day action).
-The 5-10-20 Timer System is BUY.
-The 5-day EMA is above the 10-day EMA, so short-term momentum is bullish.
-S&P 500 spread vs. Utilities (XLU-ETF) shows the Index outpacing Utilities and bouncing higher.
-There was a Follow-thru day on 14 Sept. followed by a Distribution Day 15 Sept.
-There have been 3 Statistically-Significant days (big moves in price-volume) in the last 15-days.
-Sentiment.
-Bollinger Band Squeeze 28 April - expired.
-Bollinger Bands.
-The 50-dMA percentage of issues advancing on the NYSE (Breadth) has not been below 50%, for more than 3 days in a row.
-Overbought/Oversold Index (Advance/Decline Ratio).
-Issues advancing on the NYSE (Breadth) compared to the S&P 500.
-10 August there was a Bullish Outside Reversal Day. Expired
-Smoothed Buying Pressure minus Selling Pressure is flat.
-The S&P 500 is 6.4% above its 200-dMA. (Bear indicator is 12% above the 200-day.)
-The short-term, 10-day EMA, Fosback Hi-Low Logic Index.
-The long-term, 50-dEMA, Fosback Hi-Low Logic Index.
-There were Hindenburg Omen signals 11 & 12 Sept 2023 – expired. The McClellan Oscillator turned positive.
-There have been 5 up-days over the last 10 sessions.
-There have been 11 up-days over the last 20 sessions.
-RSI.
-There was a Zweig Breadth Thrust 31 March. That’s a rare, very-bullish sign, but the McClellan Oscillator subsequently turned negative, so this indicator has expired.
-The Calm-before-the-Storm/Panic Indicator flashed a top warning signal 15 Sept. That is partly due to volume from Options expiration.
-On average, the size of up-moves has been smaller than the size of down-moves over the last month, but not enough to send a message.
-VIX indicator.
-There were back-to-back 80%+ up-volume days 28 & 29 Aug. - Expired
-2.8% of all issues traded on the NYSE made new, 52-week highs when the S&P 500 made a new all-time-high, 3 January 2022. (There is no bullish signal for this indicator.) This indicated that the advance was too narrow and a correction was likely to be >10%. It proved correct, but is now Expired.
-The graph of the 100-day Count (the 100-day sum of up-days).
-The smoothed advancing volume on the NYSE is falling.
-The 10-dMA percentage of issues advancing on the NYSE (Breadth) is below 50%.
-MACD of the percentage of issues advancing on the NYSE (breadth) made a bearish crossover 8 September.
-My Money Trend indicator is falling.
-Short-term new-high/new-low data.
-Long-term new-high/new-low data.
-Slope of the 40-dMA of New-highs is falling.
-XLI-ETF (Cyclical Industrials) vs the S&P 500.
-McClellan Oscillator.
-43% of the 15-ETFs that I track have been up over the last 10-days. (45-55% is neutral.)
TODAY’S RANKING OF 15 ETFs (Ranked Daily)
ETF ranking follows:

*For additional background on the ETF ranking system see NTSM Page at…
http://navigatethestockmarket.blogspot.com/p/exchange-traded-funds-etf-ranking.html
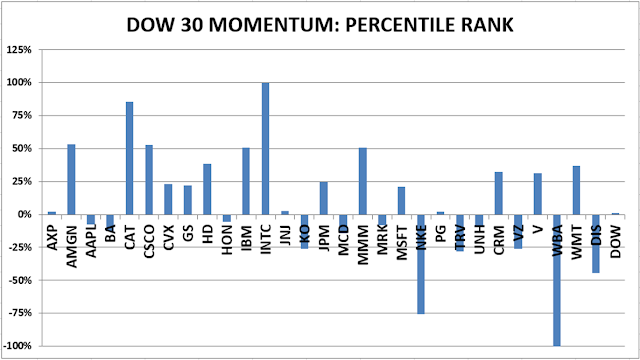
DOW 30 momentum ranking follows:
For more details, see NTSM Page at…
https://navigatethestockmarket.blogspot.com/p/a-system-for-trading-dow-30-stocks-my_8.html
