“Trade what you see; not what you think.” – The Old Fool, Richard McCranie, trader extraordinaire.
“Personal income increased $87.6 billion (0.4% at a monthly rate) in August, according to estimates released by the Bureau of Economic Analysis...” From...
https://www.floordaily.net/flooring-news/personal-income-and-spending-both-rose-04-in-august
“Consumer prices, as measured by the personal consumption expenditures (PCE) price index, rose 3.5% over the last 12 months as of August, up from 3.4% in July and 3.2% in June, the Bureau of Economic Analysis said Friday. The increase was driven mostly by rising gas prices... “Core” PCE, which excludes volatile prices for food and energy, rose just 0.1% in August, making for a 3.9% increase over the year. The yearly change was down from 4.3% in July and the lowest since May 2021...” Story at...
https://www.investopedia.com/rising-gas-prices-drive-fed-s-favorite-inflation-measure-up-for-a-third-month-8285911
“The latest Chicago Purchasing Manager's Index (Chicago Business Barometer) fell to 44.1 in September from 48.7 in August. The latest reading is worse than the 47.6 forecast and marks the 13th straight month in contraction territory.” Analysis at...
https://www.advisorperspectives.com/dshort/updates/2023/09/29/chicago-pmi-contracts-13-consecutive-months
-Friday the S&P 500 dipped about 0.3% to 4288.
-VIX rose about 1% to 17.52.
-The yield on the 10-year Treasury declined to 4.579%.
-Drop from Top: 10.6%. 25.4% max (on a closing basis).
-Trading Days since Top: 437-days.
The S&P 500 is 2.1% ABOVE its 200-dMA and 3.7% BELOW its 50-dMA.
*I won’t call the correction over until the S&P 500 makes a new-high; however, evidence suggests the bottom was in the 3600 area and we called a buy on 4 October 2022.
XLK – Technology ETF (holding since the October 2022 lows).
XLY - Consumer Discretionary ETF. (Holding since the October 2022 lows - I bought more XLY Monday, 8/21.)
I took profits and then reestablished positions as follows:
SPY – I bought a large position in the S&P 500 Friday, 8/14, in my 401k (it has limited choices).
XLE – Added Tuesday, 8/22.
SSO – 2x S&P 500 ETF. Added 8/24.
CSCO – added 9/5.
I heard a discussion on CNBC yesterday by Bob Pisani where he said that oversold conditions are not a signal to buy, but rather a condition. For the most part, that’s true in significant corrections. In a big downturn, oversold conditions can last a long time. However, in smaller corrections (as is the one we’re in now), oversold signals from Bollinger Bands, RSI and other signs can be a good bottom indicator. As such, I think the markets found a bottom in the 4275 range on 26 September. Today’s intraday low tested that level and bounced higher, so that was one piece of good news today.
-The 100-dMA percentage of issues advancing on the NYSE (Breadth) is above 50%.
-RSI.
-XLI-ETF (Cyclical Industrials) vs the S&P 500.
-S&P 500 spread vs. Utilities (XLU-ETF) shows the Index outpacing Utilities.
-There 5 Distribution Days since 15 Sept. – Not enough to send a message.
-There have been 4 Statistically-Significant days (big moves in price-volume) in the last 15-days.
-Sentiment.
-Bollinger Band Squeeze 28 April - expired.
-Bollinger Bands.
-Overbought/Oversold Index (Advance/Decline Ratio).
-Issues advancing on the NYSE (Breadth) compared to the S&P 500.
-10 August there was a Bullish Outside Reversal Day. Expired
-The S&P 500 is 2.1% above its 200-dMA. (Bear indicator is 12% above the 200-day.)
-The short-term, 10-day EMA, Fosback Hi-Low Logic Index.
-The long-term, 50-dEMA, Fosback Hi-Low Logic Index.
-There were Hindenburg Omen signals 11 & 12 Sept 2023 – expired. The McClellan Oscillator turned positive.
-There have been 4 up-days over the last 10 sessions.
-There have been 9 up-days over the last 20 sessions.
-There was a Zweig Breadth Thrust 31 March. That’s a rare, very-bullish sign, but the McClellan Oscillator subsequently turned negative, so this indicator has expired.
-The Calm-before-the-Storm/Panic Indicator flashed a top warning signal 15 Sept., but it may well have been a bottom signal. But the signal is partly due to volume from Options expiration. Call it neutral.
-VIX indicator.
-The Smart Money (late-day action).
-There was a 90% down-volume days 21 Sept, but only 1 so far.
-2.8% of all issues traded on the NYSE made new, 52-week highs when the S&P 500 made a new all-time-high, 3 January 2022. (There is no bullish signal for this indicator.) This indicated that the advance was too narrow and a correction was likely to be >10%. It proved correct, but is now Expired.
-The graph of the 100-day Count (the 100-day sum of up-days).
-There was a New-high/new-low reversal 29 September in the morning, but the signal faded as the markets fell later in the day.
-The smoothed advancing volume on the NYSE is falling.
-The 10-dMA percentage of issues advancing on the NYSE (Breadth) is below 50%.
-The 50-dMA percentage of issues advancing on the NYSE (Breadth) is above 50%
-The 50-dMA percentage of issues advancing on the NYSE (Breadth) has been below 50%, for more than 3 days in a row.
-MACD of the percentage of issues advancing on the NYSE (breadth) made a bearish crossover 8 September.
-Smoothed Buying Pressure minus Selling Pressure.
-MACD of S&P 500 price made a bearish crossover 18 Sept.
-My Money Trend indicator is falling.
-Long-term new-high/new-low data.
-Short-term new-high/new-low data.
-Slope of the 40-dMA of New-highs is falling.
-McClellan Oscillator.
-On average, the size of up-moves has been significantly smaller than the size of down-moves over the last month.
-The 5-10-20 Timer System is SELL.
-The 5-day EMA is below the 10-day EMA, so short-term momentum is bearish.
-34% of the 15-ETFs that I track have been up over the last 10-days. (45-55% is neutral.)
I’m not selling now. I’d prefer to hang on since I am still expecting a relatively shallow pullback from August highs and if the markets haven’t bottomed yet, they are not far from it.
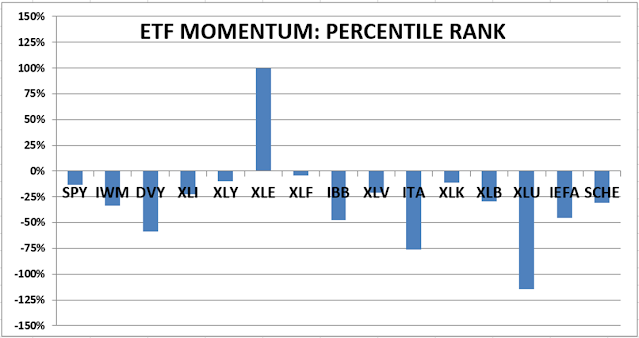
TODAY’S RANKING OF 15 ETFs (Ranked Daily)
ETF ranking follows:
*For additional background on the ETF ranking system see NTSM Page at…
http://navigatethestockmarket.blogspot.com/p/exchange-traded-funds-etf-ranking.html
DOW 30 momentum ranking follows:
For more details, see NTSM Page at…
https://navigatethestockmarket.blogspot.com/p/a-system-for-trading-dow-30-stocks-my_8.html
FRIDAY MARKET INTERNALS (NYSE DATA)
