“Trade what you see; not what you think.” – The Old Fool,
Richard McCranie, trader extraordinaire.
“Far
more money has been lost by investors in preparing for corrections, or
anticipating corrections, than has been lost in the corrections themselves.” -
Peter Lynch, former manager of Fidelity’s Magellan® fund.
“They [referring to Biden’s OP ED in the Washington Post]
decided the time has come to eliminate the Supreme Court as we know it... In his op-ed, the president says he
wants term limits to his own justices. Never mind what the Constitution says.
Never mind the advice and consent role of the Senate. President Biden and his
leftist allies don't like the current composition of the court, so they want to
shred the Constitution to change it. He wants what he calls an ethics code, but
that already exists. What the president is actually proposing is a stealth
process for people other than the justices to decide cases. Again, the
Constitution be damned.” – Mitch McConnell, (R) Senator from KY.
“For decades we disagreed with [Supreme] Court rulings
when progressives held sway, but we never called the Court illegitimate. But
now that the left has lost the Court as a backup legislature for its policy
goals, the institution is supposedly broken. Tell us again who is the threat to
democratic institutions?” – WSJ Editorial Board.
IRAN UNDERMINING TRUMP CANDIDACY (CNN via msn.com)
“Iran is using covert social media activity and related
influence operations in an effort to undercut the candidacy of former President
Donald Trump, a US intelligence official said Monday in an updated assessment
of threats to the November election...because Iranian leaders want to avoid an
outcome they perceive would increase tensions with the United States,” the
Office of the Director of National Intelligence (ODNI) said in a statement... In the 2020 election campaign, Iran “carried
out a multi-pronged covert influence campaign intended to undercut former
President Trump’s reelection prospects,” according to a declassified US intelligence report.”
Story at...
Iran
using covert influence campaign to undermine Trump candidacy, US intelligence
says (msn.com)
INFLUENCER VISITS THE WEST BANK – ALMOST DIDN’T MAKE IT
OUT ALIVE (Fox News vis msn.com)
"It was like one after another, massive love and
support for Hamas...I was specifically looking for younger people thinking, OK,
someone here is not going to support Hamas. And they all do," he
continued. "It really ranged from sympathy to actual love and admiration
for Hamas…. I thought I would find at least some people who were not diehard
Hamas supporters, and I couldn’t find one." - Zach Sage
Fox, Comedian and social media influencer. Story at...
Influencer
went to the West Bank to see if Palestinians support Hamas – he almost didn’t
make it out alive (msn.com)
CONSUMER CONFIDENCE (Conference Board)
“Confidence increased in July, but not enough to break
free of the narrow range that has prevailed over the past two years,”
said Dana M. Peterson, Chief Economist at The Conference Board. “Even
though consumers remain relatively positive about the labor market, they still
appear to be concerned about elevated prices and interest rates, and
uncertainty about the future; things that may not improve until next year... The proportion of consumers predicting
a forthcoming recession ticked up in July but remains well below the
2023 peak. Consumers’ assessments of their Family’s Financial Situation—both
currently and over the next six months—was less positive. Indeed, assessments
of familial finances have deteriorated continuously since the beginning of
2024.’” Press release at...
https://www.conference-board.org/topics/consumer-confidence
MARKET REPORT / ANALYSIS
-Tuesday the S&P 500 declined about 0.5% to 5436.
-VIX rose about 6% to 17.65.
-The yield on the 10-year Treasury declined to 4.140%
(compared to this time, prior trading day).
MY TRADING POSITIONS:
XLK – Holding since the October 2022 lows.
XLK – added more 7/26. This reestablishes the position I
had before this recent weakness.
UWM – added 7/15.
QLD – added 7/24.
DWCPF - Dow Jones U.S. Completion Total Stock Market
(TSM) Index, a broad market index made up of stocks of U.S. companies not
included in the S&P 500 Index. – Added 7/29/2024
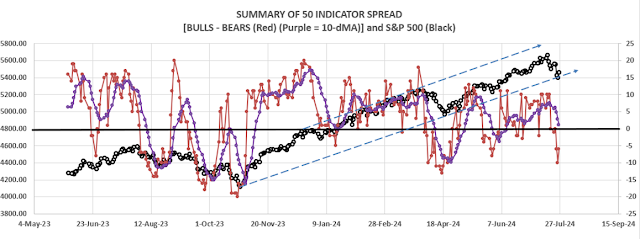
CURRENT SUMMARY OF APPROXIMATELY 50 INDICATORS:
The Bull/Bear Spread count deteriorated to 15 Bear-signs
and 6-Bull. (The rest are neutral. It is normal to have a lot of neutral
indicators since many of those are top or bottom indicators that will signal
only at extremes.)
The Bull/Bear, 50-Indicator spread (Bull Indicators minus
Bear Indicators) declined from -7 to -9 (9 more Bear indicators than Bull
indicators).
TODAY’S COMMENT:
The S&P 500 dropped below its 50-dMA for most of the
day; improved after 1pm; but then dipped again in the final minutes of trading
to close below its 50-dMA. That’s not a good sign.
Microsoft beat on earnings and revenue, but cloud
services disappointed and the beats may not have beaten the whisper
numbers. MSFT fell about 6% in after-hours
trading as of 4:30 pm. That is not a good sign either. Worse...
There were signs of deteriorating Breadth today – the 10-dMA
of the % of issues advancing on the NYSE dipped below 50% today. That’s shows that over the last 2 weeks, less
than half of the issues on the NYSE have gone up. Speaking of bad signs...
The 10-dMA of the 50-indicator spread (purple line in the
chart above) slipped to -2. I said that
when that stat starts moving up, I’ll add to stocks. On further consideration,
I decided to add to stocks Monday.
I may have gotten too far ahead of my indicators. Someday
I’ll learn to follow my own indicators! (Trade what you see – not what you think.)
The good news is that the S&P 500 remains above it lower trendline.
LONG-TERM INDICATOR: The Long Term NTSM indicator remained
SELL: PRICE, VOLUME, & VIX were bearish; SENTIMENT is neutral.
This always raises a question, should I sell? That
depends mostly on whether I am predicting a big correction or a more normal
pullback. Breadth going into this decline was good, so I do not expect a big
correction. Therefore, I won’t sell.
(The Long-Term Indicator is not a good top-indicator. It
can signal BUY at a top.)
(The important major BUY in this indicator was on 21
October 2022, 7-days after the bear-market bottom. For my NTSM overall signal,
I suggested that a short-term buying opportunity occurred on 27 September
(based on improved market internals on the retest), although without market
follow-thru, I was unwilling to call a buy; however, I did close shorts and
increased stock holdings. I issued a Buy-Signal on 4 October, 6-days before the
final bottom, based on stronger market action that confirmed the market internals
signal. The NTSM sell-signal was issued 21 December, 9 sessions before the high
of this recent bear market, based on the bearish “Summary of 50” indicator.
BOTTOM LINE
I need to turn Bearish on the market, because that’s what
the indicators are suggesting. Now it’s
up to the Fed. I suspect if they hint at
a rate cute in September, markets will be positive. Otherwise, the pullback
will be back.
I may be a seller if the Fed doesn't help us out.
ETF - MOMENTUM ANALYSIS:
TODAY’S RANKING OF 15 ETFs (Ranked Daily) ETF ranking
follows:
The top ranked ETF receives
100%. The rest are then ranked based on their momentum relative to the leading
ETF.
*For additional background on
the ETF ranking system see NTSM Page at…
http://navigatethestockmarket.blogspot.com/p/exchange-traded-funds-etf-ranking.html
DOW STOCKS - TODAY’S MOMENTUM RANKING
OF THE DOW 30 STOCKS (Ranked Daily)
The top ranked Stock receives
100%. The rest are then ranked based on their momentum relative to the leading Stock.
For more details, see NTSM
Page at…
https://navigatethestockmarket.blogspot.com/p/a-system-for-trading-dow-30-stocks-my_8.html
TUESDAY MARKET INTERNALS (NYSE
DATA)
My basket of Market Internals declined to SELL. (My basket of Market
Internals is a decent trend-following analysis of current market action, but
should not be used alone for short term trading. They are most useful when they
diverge from the Index.)
...My current invested
position is about 70% stocks, including stock mutual funds and ETFs. I’m
usually about 50% invested in stocks when markets are stretched; my current
stock position is slightly above the norm. (75% is my max stock allocation when
I am strongly bullish.)
I trade about 15-20% of the total portfolio using the
momentum-based analysis I provide here. When I see a definitive bottom, I add a
lot more stocks to the portfolio, usually by using an S&P 500 ETF as I did
back in October 2022 and 2023.