CPI ... Jobless Claims ... Momentum Trading DOW Stocks & ETFs … Stock Market Analysis ...
Political commentary from...
https://www.reviewjournal.com/opinion/michael-ramirez/cartoon-heating-up-3088505/
“Trade what you see; not what you think.” – The Old Fool,
Richard McCranie, trader extraordinaire.
“Far
more money has been lost by investors in preparing for corrections, or
anticipating corrections, than has been lost in the corrections themselves.” -
Peter Lynch, former manager of Fidelity’s Magellan® fund.
“Mr. Biden’s interview with George
Stephanopoulos was not unlike the conversations I have had, as a
practicing medical neuropsychologist, with countless dementia patients
regarding their inability to continue driving. “I have been driving for 50 years.
Just watch me,” they say.” - Paul M.
Dammers, Ph.D., WSJ letters.
“...Washington could be trusted with power because he was
ready to relinquish it. His aura of greatness was enhanced because he was ready
to surrender power when he felt the encroachment of age. If Mr. Biden were to
relinquish power, he would leave office with honor.” - Eileen Pollock, WSJ Letters
Now the Dems want to impeach Justices Alito and Thomas...
“For decades we disagreed with [Supreme] Court rulings
when progressives held sway, but we never called the Court illegitimate. But
now that the left has lost the Court as a backup legislature for its policy
goals, the institution is supposedly broken. Tell us again who is the threat to
democratic institutions?” – WSJ Editorial Board.
STRANGE DAY IN THE STOCK MARKET (CNBC)
“Bespoke Investment Group shared two statistics on
the social media
site X to demonstrate how rare it is to have that type of
split. Thursday was just the second day since 1979 when the Russell 2000 rose
more than 3% while the S&P 500 declined. The Nasdaq Composite
underperformed the Russell 2000 by more than 5 percentage points in what
appears to be biggest daily gap on record...
... every stock in the so-called Magnificent Seven fell,
including a more than 5% decline for Nvidia and
a 2.3% drop for Apple, which
dragged down both the S&P 500 and Nasdaq Composite.” Story at...
https://www.cnbc.com/2024/07/11/thursday-was-a-strange-day-in-the-stock-market-that-may-be-good-news.html
CPI / CORE CPI (CNN)
“The Consumer Price Index, a measurement of the average
change in prices for a commonly purchased basket of goods and services, dropped
0.1% from May, which helped to slow the annual rate of inflation to 3% from 3.3% in
May, according to the Bureau of Labor Statistics’ latest report... Excluding
energy and food prices, a closely watched “core” index of underlying inflation
also slowed more than expected. The core CPI rose 0.1% from May — its slowest
pace since August 2021 — nudging the annual rate of core inflation lower, to
3.3% from 3.4%...” Story at...
https://www.cnn.com/2024/07/11/economy/us-cpi-consumer-inflation-june/index.html
JOBLESS CLAIMS (ABCNews)
“The Labor Department reported Thursday that jobless
claims for the week ending July 6 fell by 17,000 to 222,000 from 239,000 the
previous week.” Story at...
https://abcnews.go.com/Business/wireStory/fewer-americans-apply-jobless-claims-week-labor-market-111841993
MARKET REPORT / ANALYSIS
-Thursday the S&P 500 declined about 0.9% to 5584.54.
-VIX rose about 0.5% to 12.92. (Not much higher for a
nearly 1% drop on the S&P 500.)
-The yield on the 10-year Treasury declined to 4.211%
(compared to this time yesterday).
MY TRADING POSITIONS:
XLK – Holding since the October 2022 lows.
CURRENT SUMMARY OF APPROXIMATELY 50 INDICATORS:
The Bull/Bear Spread (Bull Indicators minus Bear
Indicators) was a Bullish 7 Bear-signs and 18-Bull. (The rest are neutral. It
is normal to have a lot of neutral indicators since many of those are top or
bottom indicators that will signal only at extremes.) The 10-dMA of spread (purple
line in the chart below also reversed up, a bull-sign.
The Bull/Bear, 50-Indicator spread improved from +7 to +11
(11 more Bull indicators than Bear).
TODAY’S COMMENT:
The Index broke above the upper trend line in the wedge
pattern yesterday (red, dashed-lines in the above chart), but declined back
into the wedge zone today. In my opinion, we still need to worry about the
bearish rising wedge in the charts.
Thursday there was another Bearish outside
reversal day. Today’s is the fifth one in 4-weeks.
According to Investopedia: “This demonstrates that the
bulls had control over the market before the bears took the reins in a
meaningful way, signaling a shift in the overall trend... For instance, a
stock may have a small move higher on the first day, climb even higher the
second day, but then sharply decline by the second day’s end... This formation
is considered a strong indicator that the prior upward momentum is waning and a
reversal is on the horizon.”
https://www.investopedia.com/terms/o/outsidereversal.asp#:~:text=A%20bearish%20outside%20reversal%2C%20also,by%20the%20second%20day's%20end
“On the horizon” seems to be the key. How long does one wait? Yesterday there was
nearly a top-warning, so we are left to wonder whether yesterday was a top. Internals and most indicators would say, no.
Thursday was a statistically significant down-day. That
just means that the price-volume move exceeded my statistical parameters.
Statistics show that a statistically-significant, down-day is followed by a up-day
about 60% of the time.
Today, 80% of volume was up-volume; advancers outpaced
decliners by 6 to 1; and there were 279 new, 52-week new highs on the NYSE. Those
are solid numbers and it’s hard to believe the S&P 500 was down. Usually, the Index follows the majority so I
would expect the S&P 500 to follow higher Friday, but we still see issues
in the market.
The S&P 500 is 13.7% above the 200-dMA and that
remains stretched. The bear sign is greater than 12%.
Statistical analysis of daily moves is indicating that
the daily moves have gotten too predictably small, a sign of complacency. This
suggests a top within the next 20-days. The last time we saw this indicator was
at the 31 July top last year. That was followed by a 10% correction.
LONG-TERM INDICATOR: The Long Term NTSM indicator
remained HOLD: PRICE, VOLUME, VIX & SENTIMENT are neutral.
(The Long-Term Indicator is not a good top-indicator.
It can signal BUY at a top.)
(The important major BUY in this indicator was on 21 October
2022, 7-days after the bear-market bottom. For my NTSM overall signal, I
suggested that a short-term buying opportunity occurred on 27 September (based
on improved market internals on the retest), although without market
follow-thru, I was unwilling to call a buy; however, I did close shorts and
increased stock holdings. I issued a Buy-Signal on 4 October, 6-days before the
final bottom, based on stronger market action that confirmed the market
internals signal. The NTSM sell-signal was issued 21 December, 9 sessions
before the high of this recent bear market, based on the bearish “Friday Rundown”
of indicators.)
BOTTOM LINE
I am still Neutral on the market. It’s hard to be bullish
when there are issues to be resolved. A pullback is coming, but we don’t yet
have a smoking gun to say it’s here. My guess now is that we’ll see a 5-7%
correction in late July or early August, but I’ll wait for the indicators. It
may change based on what we see. If we expect a small correction I won’t make
any portfolio changes; I don’t like to try to time corrections unless I expect
a 10% or greater pullback.
ETF - MOMENTUM ANALYSIS:
TODAY’S RANKING OF 15 ETFs (Ranked Daily) ETF ranking
follows:

The top ranked ETF receives
100%. The rest are then ranked based on their momentum relative to the leading
ETF.
*For additional background on
the ETF ranking system see NTSM Page at…
http://navigatethestockmarket.blogspot.com/p/exchange-traded-funds-etf-ranking.html
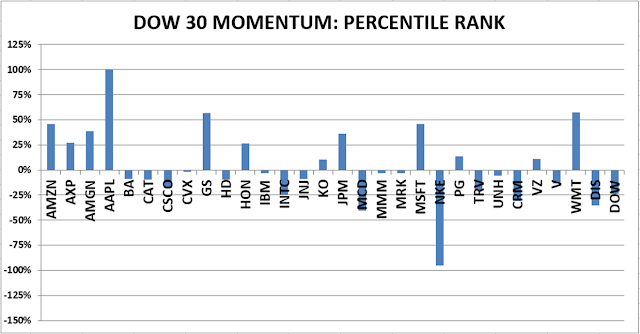
DOW STOCKS - TODAY’S MOMENTUM RANKING
OF THE DOW 30 STOCKS (Ranked Daily)
The top ranked Stock receives
100%. The rest are then ranked based on their momentum relative to the leading Stock.
For more details, see NTSM
Page at…
https://navigatethestockmarket.blogspot.com/p/a-system-for-trading-dow-30-stocks-my_8.html
THURSDAY MARKET INTERNALS (NYSE
DATA)
My basket of Market Internals improved to BUY. (My basket of Market
Internals is a decent trend-following analysis of current market action, but
should not be used alone for short term trading. They are most useful when they
diverge from the Index.)
.My current invested
position is about 50% stocks, including stock mutual funds and ETFs. I’m
usually about 50% invested in stocks, so this is normal invested position. (75%
is my max stock allocation so I have some cash now.)
I trade about 15-20% of the total portfolio using the
momentum-based analysis I provide here. When I see a definitive bottom, I add a
lot more stocks to the portfolio, usually by using an S&P 500 ETF as I did
back in October 2022 and 2023.