“We read the Democratic press so you don’t have to, and these days the anguish on the left is palpable. The political reality of the party’s predicament in covering for President Biden’s infirmities for so long is finally sinking in. Could it be that Democrats will end up re-electing Donald J. Trump? Yes it could... A younger Republican would be winning in a rout. This means Mr. Biden can point to some polls showing a still close race, and it may be why he’ll refuse to leave even as the panic and pressure from his fellow Democrats increase. The Democrats did this to themselves, but the tragedy is they also did it to the country.” – WSJ Editorial Board.
“Federal Reserve Chair Jerome Powell said Monday that the central bank will not wait until inflation hits 2% to cut interest rates.” Story at...
https://www.cnbc.com/2024/07/15/powell-indicates-fed-wont-wait-until-inflation-is-down-to-2percent-before-cutting-rates.html
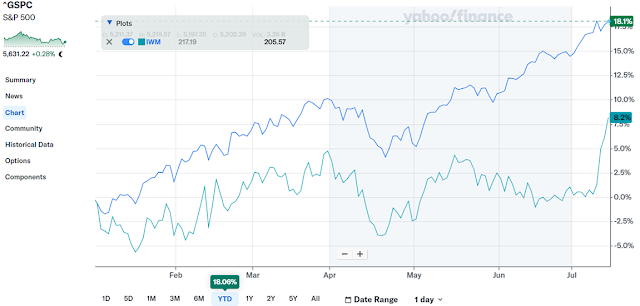
-Monday the S&P 500 rose about 0.3% to 5631.
-VIX rose about 5% to 13.12. (The Options Boys are worried.)
-The yield on the 10-year Treasury rose to 4.230% (compared to this time, prior trading day).
XLK – Holding since the October 2022 lows
UWM - Added 15 July.
CURRENT SUMMARY OF APPROXIMATELY 50 INDICATORS:
The Bull/Bear Spread (Bull Indicators minus Bear Indicators) remained a Bullish 10 Bear-signs and 16-Bull. (The rest are neutral. It is normal to have a lot of neutral indicators since many of those are top or bottom indicators that will signal only at extremes.) The 10-dMA of spread (purple line in the chart below) turned down – not what the bulls want.

The Bull/Bear, 50-Indicator spread slipped from +10 to +6
(6 more Bull indicators than Bear).
TODAY’S COMMENT:
Not much new today. The negative signs remain.
-The S&P 500 is 14.3% above the 200-dMA and that remains stretched. The bear sign is greater than 12%. This is a reliable indicator, but the market can be stretched higher, so it does not always give a timely signal.
-Breadth as measured by the % of stocks advancing on the NYSE remains lagging too far behind the S&P 500.
-Statistical analysis of daily moves is indicating that the daily moves have gotten too predictably small, a sign of complacency. This suggests a top within the next 20-days. The last time we saw this indicator was at the 31 July top last year. That was followed by a 10% correction. This is a very good indicator, but we don’t know what will cause a pullback to start.
Market action seems to be finally favoring the small cap
stocks. I took profits on my small cap
bets earlier, but they weren’t big profits – I was early. It looks like the small cap stocks are
finally getting a strong bid so I bought the 2x Russell 2000 ETF (UWM) today.
For the year, the Russell 2000 is still underperforming by a lot so it’s a reasonable
bet that the Russell 2000 will catch up. They have jumped a lot since last
week; let’s hope it’s not too much too fast.
LONG-TERM INDICATOR: The Long Term NTSM indicator
remained HOLD: PRICE, VOLUME, VIX & SENTIMENT are neutral.
(The Long-Term Indicator is not a good top-indicator. It can signal BUY at a top.)
(The important major BUY in this indicator was on 21
October 2022, 7-days after the bear-market bottom. For my NTSM overall signal,
I suggested that a short-term buying opportunity occurred on 27 September
(based on improved market internals on the retest), although without market
follow-thru, I was unwilling to call a buy; however, I did close shorts and
increased stock holdings. I issued a Buy-Signal on 4 October, 6-days before the
final bottom, based on stronger market action that confirmed the market internals
signal. The NTSM sell-signal was issued 21 December, 9 sessions before the high
of this recent bear market, based on the bearish “Friday Rundown” of
indicators.)
BOTTOM LINE
I am still Neutral on the market (a moderate pullback is coming), but short-term, the risk-on, bullish fever (FOMO) seems to be holding sway over the markets.
ETF - MOMENTUM ANALYSIS:
TODAY’S RANKING OF 15 ETFs (Ranked Daily) ETF ranking follows:

The top ranked ETF receives
100%. The rest are then ranked based on their momentum relative to the leading
ETF.
*For additional background on the ETF ranking system see NTSM Page at…
http://navigatethestockmarket.blogspot.com/p/exchange-traded-funds-etf-ranking.html
DOW STOCKS - TODAY’S MOMENTUM RANKING
OF THE DOW 30 STOCKS (Ranked Daily)
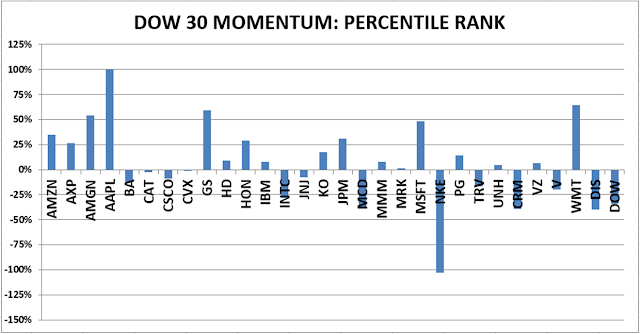
The top ranked Stock receives 100%. The rest are then ranked based on their momentum relative to the leading Stock.
For more details, see NTSM Page at…
https://navigatethestockmarket.blogspot.com/p/a-system-for-trading-dow-30-stocks-my_8.html
MONDAY MARKET INTERNALS (NYSE
DATA)
 My basket of Market Internals declined to HOLD. (My basket of Market
Internals is a decent trend-following analysis of current market action, but
should not be used alone for short term trading. They are most useful when they
diverge from the Index.)
My basket of Market Internals declined to HOLD. (My basket of Market
Internals is a decent trend-following analysis of current market action, but
should not be used alone for short term trading. They are most useful when they
diverge from the Index.)
 ...My current invested
position is about 55% stocks, including stock mutual funds and ETFs. I’m
usually about 50% invested in stocks when markets are stretched; my current stock
position is slightly above the norm. (75% is my max stock allocation when I am
strongly bullish.)
...My current invested
position is about 55% stocks, including stock mutual funds and ETFs. I’m
usually about 50% invested in stocks when markets are stretched; my current stock
position is slightly above the norm. (75% is my max stock allocation when I am
strongly bullish.)
I trade about 15-20% of the total portfolio using the
momentum-based analysis I provide here. When I see a definitive bottom, I add a
lot more stocks to the portfolio, usually by using an S&P 500 ETF as I did
back in October 2022 and 2023.
The Bull/Bear Spread (Bull Indicators minus Bear Indicators) remained a Bullish 10 Bear-signs and 16-Bull. (The rest are neutral. It is normal to have a lot of neutral indicators since many of those are top or bottom indicators that will signal only at extremes.) The 10-dMA of spread (purple line in the chart below) turned down – not what the bulls want.
Not much new today. The negative signs remain.
-The S&P 500 is 14.3% above the 200-dMA and that remains stretched. The bear sign is greater than 12%. This is a reliable indicator, but the market can be stretched higher, so it does not always give a timely signal.
-Breadth as measured by the % of stocks advancing on the NYSE remains lagging too far behind the S&P 500.
-Statistical analysis of daily moves is indicating that the daily moves have gotten too predictably small, a sign of complacency. This suggests a top within the next 20-days. The last time we saw this indicator was at the 31 July top last year. That was followed by a 10% correction. This is a very good indicator, but we don’t know what will cause a pullback to start.
(The Long-Term Indicator is not a good top-indicator. It can signal BUY at a top.)
I am still Neutral on the market (a moderate pullback is coming), but short-term, the risk-on, bullish fever (FOMO) seems to be holding sway over the markets.
TODAY’S RANKING OF 15 ETFs (Ranked Daily) ETF ranking follows:
*For additional background on the ETF ranking system see NTSM Page at…
http://navigatethestockmarket.blogspot.com/p/exchange-traded-funds-etf-ranking.html
The top ranked Stock receives 100%. The rest are then ranked based on their momentum relative to the leading Stock.
For more details, see NTSM Page at…
https://navigatethestockmarket.blogspot.com/p/a-system-for-trading-dow-30-stocks-my_8.html