“Trade what you see; not what you think.” – The Old Fool, Richard McCranie, trader extraordinaire.
My cmt: I heard an interview with Dean Phillips back when he was running for President. He sounded like a reasonable and smart fellow. Too bad the Dem’s weren’t willing to see Biden’s failings back then, although Dean was probably too middle-of-the-road. The Dems have gone hard left.
-Wednesday the S&P 500 rose about 1% to 5634, a new, all-time high.
-VIX rose about 3% to 12.85. (The Options Players are nervous.)
-The yield on the 10-year Treasury declined to 4.281% (compared to this time yesterday).
XLK – Holding since the October 2022 lows.
The Bull/Bear Spread (Bull Indicators minus Bear Indicators) reversed again, this time back to a Bullish 10 Bear-signs and 17-Bull. (The rest are neutral. It is normal to have a lot of neutral indicators since many of those are top or bottom indicators that will signal only at extremes.) The 10-dMA of spread (purple line in the chart below also reversed up, a bull-sign. (We may want to smooth the purple line by using a longer time-frame. It has been reversing more than I’d like.)

Indicators for the S&P 500 were close to issuing a top warning today, but instead remained neutral. Bollinger Bands were overbought, but RSI was not quite there. A couple of other indicators are already issuing top warnings.
Wednesday
was a statistically significant up-day. That just means that the price-volume
move exceeded my statistical parameters. Statistics show that a
statistically-significant, up-day is followed by a down-day about 60% of the
time. Tops almost always occur on Statistically-significant,
up-days, but not all statistically-significant, up-days occur at tops. Today
could be a short-term top, there were 4 top indicators that were bearish, but
not enough to send a strong top-signal.
LONG-TERM INDICATOR: The Long Term NTSM indicator
remained HOLD: PRICE s bullish; VOLUME, VIX & SENTIMENT are neutral.
(The Long-Term Indicator is not a good top-indicator. It can signal BUY at a top.)
(The important major BUY in this indicator was on 21
October 2022, 7-days after the bear-market bottom. For my NTSM overall signal,
I suggested that a short-term buying opportunity occurred on 27 September
(based on improved market internals on the retest), although without market
follow-thru, I was unwilling to call a buy; however, I did close shorts and
increased stock holdings. I issued a Buy-Signal on 4 October, 6-days before the
final bottom, based on stronger market action that confirmed the market internals
signal. The NTSM sell-signal was issued 21 December, 9 sessions before the high
of this recent bear market, based on the bearish “Friday Rundown” of
indicators.)
BOTTOM LINE
No change: I am Neutral on the market. A pullback is coming, but we don’t yet have a smoking gun to say it’s here. My guess now is that we’ll see a 5-7% correction in late July or early August, but I’ll wait for the indicators. It may change based on what we see. If we expect a small correction I won’t make any portfolio changes; I don’t like to try to time corrections unless I expect a 10% or greater pullback.
ETF - MOMENTUM ANALYSIS:
TODAY’S RANKING OF 15 ETFs (Ranked Daily) ETF ranking follows:

*For additional background on the ETF ranking system see NTSM Page at…
http://navigatethestockmarket.blogspot.com/p/exchange-traded-funds-etf-ranking.html
DOW STOCKS - TODAY’S MOMENTUM RANKING
OF THE DOW 30 STOCKS (Ranked Daily)

The top ranked Stock receives
100%. The rest are then ranked based on their momentum relative to the leading Stock.
For more details, see NTSM Page at…
https://navigatethestockmarket.blogspot.com/p/a-system-for-trading-dow-30-stocks-my_8.html
WEDNESDAY MARKET INTERNALS
(NYSE DATA)
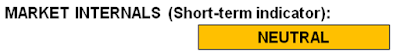 My basket of Market Internals remained HOLD. (My basket of Market
Internals is a decent trend-following analysis of current market action, but
should not be used alone for short term trading. They are most useful when they
diverge from the Index.)
My basket of Market Internals remained HOLD. (My basket of Market
Internals is a decent trend-following analysis of current market action, but
should not be used alone for short term trading. They are most useful when they
diverge from the Index.)
 ...My current invested
position is about 50% stocks, including stock mutual funds and ETFs. I’m
usually about 50% invested in stocks, so this is normal invested position. (75%
is my max stock allocation so I have some cash now.)
...My current invested
position is about 50% stocks, including stock mutual funds and ETFs. I’m
usually about 50% invested in stocks, so this is normal invested position. (75%
is my max stock allocation so I have some cash now.)
I trade about 15-20% of the total portfolio using the
momentum-based analysis I provide here. When I see a definitive bottom, I add a
lot more stocks to the portfolio, usually by using an S&P 500 ETF as I did
back in October 2022 and 2023.
(The Long-Term Indicator is not a good top-indicator. It can signal BUY at a top.)
No change: I am Neutral on the market. A pullback is coming, but we don’t yet have a smoking gun to say it’s here. My guess now is that we’ll see a 5-7% correction in late July or early August, but I’ll wait for the indicators. It may change based on what we see. If we expect a small correction I won’t make any portfolio changes; I don’t like to try to time corrections unless I expect a 10% or greater pullback.
TODAY’S RANKING OF 15 ETFs (Ranked Daily) ETF ranking follows:
*For additional background on the ETF ranking system see NTSM Page at…
http://navigatethestockmarket.blogspot.com/p/exchange-traded-funds-etf-ranking.html
For more details, see NTSM Page at…
https://navigatethestockmarket.blogspot.com/p/a-system-for-trading-dow-30-stocks-my_8.html