“Trade what you see; not what you think.” – The Old Fool,
Richard McCranie, trader extraordinaire.
“Far
more money has been lost by investors in preparing for corrections, or
anticipating corrections, than has been lost in the corrections themselves.” -
Peter Lynch, former manager of Fidelity’s Magellan® fund.
"This is maybe the most dangerous market of my
career, and that includes 1987's crash, that includes the savings and loan
debacle market of the early '90s, that includes the 1999 to 2009 lost decade in
the S&P 500 in the dot-com bubble. This is the most difficult market of my
45 years." - Bill Smead, Smead
Value Fund (SMVLX).
"Thinking is the hardest work there is, which is the
probable reason why so few engage in it.” - Henry Ford
TRUMP ISN’T A TARIFF KING (WSJ – Excerpt)
“In a ruling heard ’round the world, the U.S. Court of
International Trade on Wednesday blocked President Trump’s sweeping tariffs.
This is an important moment for the rule of law as much as for the economy,
proving again that America doesn’t have a king who can rule by decree... No
other President has used IEEPA to impose tariffs. As the trade court
explains, Richard Nixon used the law’s precursor, the Trading With
the Enemy Act, in 1971 to impose 10% tariffs for a short period to address a
balance of payments problem...
...The White House boasts it will win at the Supreme
Court, but our reading of the trade court’s opinion suggests the opposite. Mr.
Trump’s three Court appointees are likely to invoke the major-questions
precedent. Mr. Trump has other laws he can use to impose tariffs, though most
are more limited than his emergency claims. The most expansive is Section 338
of the 1930 Smoot-Hawley Act, which lets a President impose duties up to 50% on
countries found to discriminate against the U.S. But no President has ever done
so.
Mr. Trump would be wiser to heed the trade court’s ruling
as the political gift it is and liberate his Presidency and the economy from
his destructive tariff obsessions." Opinion at...
https://www.wsj.com/opinion/donald-trump-tariffs-ieepa-court-of-international-trade-ruling-08e76022?gaa_at=eafs&gaa_n=ASWzDAiAv4XsFbLPzBqFAJ-H4NLSOEQ6UfE4mZh67CoXb9MSSklROeOb9qs47qO1R58%3D&gaa_ts=683a2797&gaa_sig=R0h-raoGZPtO6R5ZJwxCe6VqXo2t3rVBHWXfVmUSAzoLMzEtJwC-N9pDK0lNTTuuDDXYR0gJlQccpkSnwOM7ZQ%3D%3D
CAN AMERICA DODGE THE TARIFF BULLET (WSJ – Excerpt)
“The U.S. economy has dodged a bullet—or has it? The
Court of International Trade ruled on Wednesday that the Trump administration’s
reciprocal tariffs, imposed broadly on almost all goods from almost all
countries, exceed the president’s authority under the statute. The court’s
ruling recognized Congress’s role in setting tariff policy and was good news
for American businesses and consumers. But on Thursday, the U.S. Court of
Appeals for the Federal Circuit stayed the trade court’s ruling while it
considers an appeal...
...Whatever the outcome of the court battles, Americans
should hope that the tariff madness ends. While the lower temporary tariffs
weren’t as bad as those originally threatened on “Liberation Day,” they
nevertheless would produce significant adverse effects—higher consumer prices,
lower business investment and lower economic growth.” - Robert C. Pozen, senior
lecturer at MIT Sloan School of Management and a former president of Fidelity
Investments and Ernie Tedeschi, director of economics at Yale’s Budget
Lab. Commentary at...
https://www.wsj.com/opinion/can-america-dodge-a-tariff-bullet-policy-economy-law-3212de12?gaa_at=eafs&gaa_n=ASWzDAjQYIfwKTdkcHP_etZdQhNelkGs-i00eQ5XCWWyig-FDp06vIBTHDrXC01doy0%3D&gaa_ts=683a28e9&gaa_sig=96iX2kcYfq7F8qOHd_-OYhpMD_IXt5XisqXAFYZUVk805s_tgWsr5gw-_CNbL5y69OFxtULDmTB8KlDlB8857g%3D%3D
PCE (NY Times)
“The Federal Reserve’s preferred inflation measure stayed
subdued in April as spending slowed. But the outlook for the economy has become
even more muddied amid constant changes to President Trump’s policies. The
Personal Consumption Expenditures price index, released on Friday, climbed 2.1
percent in April from a year earlier, slightly lower than the previous reading
of 2.3 percent and closer in line with the Fed’s 2 percent target. On a monthly
basis, prices increased 0.1 percent after staying flat in March.” Story at...
https://www.nytimes.com/2025/05/30/business/fed-inflation-consumer-spending.html
PERSONAL INCOME (Floor Daily)
“Personal income increased $210.1 billion (0.8% at a
monthly rate) in April, according to estimates released by the U.S. Bureau of
Economic Analysis. Disposable personal income (DPI)-personal income less
personal current taxes-increased $189.4 billion (0.8%) and personal consumption
expenditures (PCE) increased $47.8 billion (0.2%).” Story at...
https://www.floordaily.net/flooring-news/personal-income-rose-08-in-april-spending-up-02#
CHICAGO PMI (Advisor Perspectives)
“The Chicago Purchasing Managers’ Index (Chicago Business
Barometer) fell for a second straight month to its lowest level in four months.
The index sank to 40.5 this month from 44.6 in April, falling short of the 45.1
forecast. The latest reading marks the 18th consecutive month the index has
contracted... Given its persistent weakness, the current level reinforces
concerns about ongoing softness in the manufacturing sector.”

Commentary at...
https://www.advisorperspectives.com/dshort/updates/2025/05/30/chicago-pmi-sinks-to-4-month-low
Note: The PMI figures are in a zone where recessions
(shown in grey on the above chart) have occurred.
MARKET REPORT / ANALYSIS
-Friday the S&P 500 was little changed at 5912.
-VIX declined about 3% to 18.57.
-The yield on the 10-year Treasury declined to 4.400%
(compared to about this time prior market day).
MY TRADING POSITIONS:
None
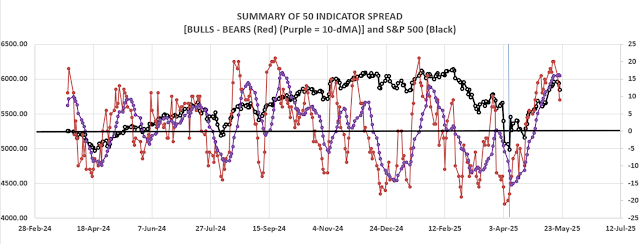
CURRENT SUMMARY OF APPROXIMATELY 50 INDICATORS:
Today, of the 50-Indicators
I track, 8 gave Bear-signs and 12 were Bullish. The rest are neutral. (It is
normal to have a lot of neutral indicators since many of the indicators are top
or bottom indicators that will signal only at extremes.)
TODAY’S COMMENT
The daily, bull-bear spread of 50-indicators declined to
Neutral at +4 (4 more Bull indicators than Bear indicators). I consider +5 to
-5 the neutral zone. The 10-dMA of the spread continued down – a bearish sign.
Indicators keep falling suggesting a return to the lower
trendline. The Lower trendline is somewhere
around 5700-5800 depending on how fast the Index declines and intersects it.
When the Index get’s there, we may have an idea whether the S&P 500 will
keep falling.
Once again, Friday, there was high, unchanged-volume (for
the third day in a row). I know, you’re tired of reading my standard note:
As I’ve often said, many believe that this indicator
suggests investor confusion at market turning points. Are markets turning back
down? That could always happen and the indicators are trending down now. Still,
“High-unchanged-volume” is not one of my indicators because it is often wrong.
BOTTOM LINE
I am neutral, but leaning bullish longer-term. In the
here-and-now, a trip to the lower trendline is underway.
ETF - MOMENTUM ANALYSIS:
TODAY’S RANKING OF 15 ETFs (Ranked Daily) ETF ranking
follows:
The top ranked ETF receives
100%. The rest are then ranked based on their momentum relative to the leading
ETF.
*For additional background on
the ETF ranking system see NTSM Page at…
http://navigatethestockmarket.blogspot.com/p/exchange-traded-funds-etf-ranking.html
DOW STOCKS - TODAY’S MOMENTUM RANKING
OF THE DOW 30 STOCKS (Ranked Daily)
The top ranked Stock receives
100%. The rest are then ranked based on their momentum relative to the leading Stock.
For more details, see NTSM
Page at…
https://navigatethestockmarket.blogspot.com/p/a-system-for-trading-dow-30-stocks-my_8.html
FRIDAY MARKET INTERNALS (NYSE
DATA)
My basket of Market Internals declined to SELL. (My basket of Market
Internals is a decent trend-following analysis that is most useful when it
diverges from the Index.)
My current invested position
is about 40% stocks, including stock mutual funds and ETFs. 50% invested in
stocks is a normal, conservative position. (75% is my max stock allocation when
I am confident that markets will continue higher; 30% in stocks is my Bear
market position.)
I trade about 15-20% of the total portfolio using the
momentum-based analysis I provide here. When I see bullish signs, I add a lot more
stocks to the portfolio, usually by using an S&P 500 ETF as I did back in
October 2022 and 2023.
“Trade what you see; not what you think.” – The Old Fool,
Richard McCranie, trader extraordinaire.
“Far
more money has been lost by investors in preparing for corrections, or
anticipating corrections, than has been lost in the corrections themselves.” -
Peter Lynch, former manager of Fidelity’s Magellan® fund.
"This is maybe the most dangerous market of my
career, and that includes 1987's crash, that includes the savings and loan
debacle market of the early '90s, that includes the 1999 to 2009 lost decade in
the S&P 500 in the dot-com bubble. This is the most difficult market of my
45 years." - Bill Smead, Smead
Value Fund (SMVLX).
GDP 2ND ESTIMATE (Advisor Perspectives)
“The U.S. economy contracted for the first time in three
years to start off 2025. The BEA's second estimate of real gross domestic
product showed economic growth decreased at an annual rate of 0.2% in Q1 2025.
The latest estimate was higher than the -0.3% forecast and lower than the Q4
final estimate of 2.5%.” Commentary
at...
https://www.advisorperspectives.com/dshort/updates/2025/05/29/gdp-gross-domestic-product-q1-2025-second-estimate
JOBLESS CLAIMS (Reuters)
“The number of Americans filing new applications for
jobless benefits increased more than expected last...The number of people
collecting unemployment checks in mid-May was the largest in 3-1/2 years. The
dimming economic outlook was reinforced by other data showing corporate profits
declining by the most in more than four years in the first quarter...Initial
claims for state unemployment benefits rose 14,000 to a seasonally adjusted
240,000 for the week ended May 24...” Story at...
https://www.reuters.com/world/us/us-weekly-jobless-claims-rise-more-than-expected-labor-market-eases-2025-05-29/
CRUDE INVENTORIES (EIA)
“U.S. commercial crude oil inventories (excluding those
in the Strategic Petroleum Reserve) decreased by 2.8 million barrels from the
previous week. At 440.4 million barrels, U.S. crude oil inventories are about
6% below the five year average for this time of year.” Report at...
https://ir.eia.gov/wpsr/wpsrsummary.pdf
TARIFF AND THE COURTS (CNBC)
“The Trump administration said it may ask the U.S.
Supreme Court as soon as Friday to immediately pause a ruling blocking many of
President Donald Trump’s tariffs... Even if the ruling stands, Trump may have
other ways of imposing import taxes without approval from Congress.” Story
at...
https://www.cnbc.com/2025/05/29/trump-court-international-trade-tariffs-miller.html
MARKET REPORT / ANALYSIS
-Thursday the S&P 500 rose about 0.4% to 5889.
-VIX declined about 0.7% to 19.18.
-The yield on the 10-year Treasury declined to 4.426%
(compared to about this time prior market day).
MY TRADING POSITIONS:
None
CURRENT SUMMARY OF APPROXIMATELY 50 INDICATORS:
Today, of the 50-Indicators
I track, 7 gave Bear-signs and 14 were Bullish. The rest are neutral. (It is
normal to have a lot of neutral indicators since many of the indicators are top
or bottom indicators that will signal only at extremes.)
TODAY’S COMMENT
The daily, bull-bear spread of 50-indicators remained
bullish at +7 (7 more Bull indicators than Bear indicators). I consider +5 to
-5 the neutral zone. The 10-dMA of the spread continued down – a bearish sign.
The federal court ruling that blocked Trumps tariffs
caused Futures to leap higher last night, but by today’s trading, it didn’t
seem to matter. I would not expect to see the Supreme Court support the
Tariffs. I’m not expert, but the
Executive Branch doesn’t have a lot of tariff power under the Constitution. The
CNBC article above noted “...Trump may have other ways of imposing import taxes
without approval from Congress.” We’ll see. Since I don’t know where this is
going, my alternative is to follow the markets and see how they react.
Indicators were unchanged today.
Once again, Thursday, there was high, unchanged-volume. I
know, you’re tired of reading my standard note:
As I’ve often said, many believe that this indicator
suggests investor confusion at market turning points. Are markets turning back
down? That could always happen and the indicators are trending down now. Still,
“High-unchanged-volume” is not one of my indicators because it is often wrong.
Repeating: If the 10-day moving average of the
50-indicator spread reverses higher I may put some more money to work and
increase to a 50% position in stocks. That didn’t happen today.
BOTTOM LINE
I am neutral but leaning bullish.
ETF - MOMENTUM ANALYSIS:
TODAY’S RANKING OF 15 ETFs (Ranked Daily) ETF ranking
follows:
The top ranked ETF receives
100%. The rest are then ranked based on their momentum relative to the leading
ETF.
*For additional background on
the ETF ranking system see NTSM Page at…
http://navigatethestockmarket.blogspot.com/p/exchange-traded-funds-etf-ranking.html
DOW STOCKS - TODAY’S MOMENTUM RANKING
OF THE DOW 30 STOCKS (Ranked Daily)
The top ranked Stock receives
100%. The rest are then ranked based on their momentum relative to the leading Stock.
For more details, see NTSM
Page at…
https://navigatethestockmarket.blogspot.com/p/a-system-for-trading-dow-30-stocks-my_8.html
THURSDAY MARKET INTERNALS (NYSE
DATA)
My basket of Market Internals remained HOLD. (My basket of Market
Internals is a decent trend-following analysis that is most useful when it
diverges from the Index.)
My current invested position
is about 40% stocks, including stock mutual funds and ETFs. 50% invested in
stocks is a normal, conservative position. (75% is my max stock allocation when
I am confident that markets will continue higher; 30% in stocks is my Bear
market position.)
I trade about 15-20% of the total portfolio using the
momentum-based analysis I provide here. When I see bullish signs, I add a lot more
stocks to the portfolio, usually by using an S&P 500 ETF as I did back in
October 2022 and 2023.
“Trade what you see; not what you think.” – The Old Fool,
Richard McCranie, trader extraordinaire.
“Far
more money has been lost by investors in preparing for corrections, or
anticipating corrections, than has been lost in the corrections themselves.” -
Peter Lynch, former manager of Fidelity’s Magellan® fund.
“Blind obedience to authority is the greatest enemy of
truth.” - Albert Einstein
"This is maybe the most dangerous market of my
career, and that includes 1987's crash, that includes the savings and loan
debacle market of the early '90s, that includes the 1999 to 2009 lost decade in
the S&P 500 in the dot-com bubble. This is the most difficult market of my
45 years." - Bill Smead, Smead
Value Fund (SMVLX).
FOMC MINUTES (FX Empire)
“On May 28, 2025, the Federal Reserve released the
Minutes of the FOMC Meeting that was held on May 6-7, 2025.
The Minutes showed that Fed believed that economic
activity continued to expand at a solid pace, while labor market conditions
remained solid. Meanwhile, inflation remained somewhat elevated.... The central
bank needs more time to assess the impact of Trump’s tariff policy, so it will
not hurry to change rates.” Story at...
https://www.fxempire.com/news/article/fomc-minutes-confirm-fed-is-not-in-a-hurry-to-cut-rates-1522422
MARKET REPORT / ANALYSIS
-Wednesday the S&P 500 declined about 0.6% to 5889.
-VIX rose about 2% to 18.96.
-The yield on the 10-year Treasury rose to 4.475%
(compared to about this time prior market day).
MY TRADING POSITIONS:
None
CURRENT SUMMARY OF APPROXIMATELY 50 INDICATORS:
Today, of the 50-Indicators
I track, 7 gave Bear-signs and 14 were Bullish. The rest are neutral. (It is
normal to have a lot of neutral indicators since many of the indicators are top
or bottom indicators that will signal only at extremes.)
TODAY’S COMMENT
That was an ugly chart today. The Bulls can’t like to see
the S&P 500 fail in the afternoon and close at the lows for the day. That
sort of selling can slip over to the next day. Indicators slipped some, too. Maybe
Nvidia’s earnings (a beat on earnings and revenue) will bring a better mood on
Thursday.
The daily, bull-bear spread of 50-indicators dropped, but
remained bullish at +7 (7 more Bull indicators than Bear indicators). I
consider +5 to -5 the neutral zone. The 10-dMA of the spread continued down – a
bearish sign.
Once again, we saw extremely High unchanged volume.
Wednesday, there was extremely high, unchanged-volume. I know, you’re tired of
reading my standard note:
As I’ve often said, many believe that this indicator
suggests investor confusion at market turning points. Are markets turning back
down? That could always happen and the indicators are trending down now. Still,
“High-unchanged-volume” is not one of my indicators because it is often wrong.
For now, if the 10-day moving average of the 50-indicator
spread reverses higher I may put some more money to work and increase to a 50%
position in stocks. That didn’t happen today.
BOTTOM LINE
I am neutral/bullish/confused. Isn’t everyone?
ETF - MOMENTUM ANALYSIS:
TODAY’S RANKING OF 15 ETFs (Ranked Daily) ETF ranking
follows:
The top ranked ETF receives
100%. The rest are then ranked based on their momentum relative to the leading
ETF.
*For additional background on
the ETF ranking system see NTSM Page at…
http://navigatethestockmarket.blogspot.com/p/exchange-traded-funds-etf-ranking.html
DOW STOCKS - TODAY’S MOMENTUM RANKING
OF THE DOW 30 STOCKS (Ranked Daily)
The top ranked Stock receives
100%. The rest are then ranked based on their momentum relative to the leading Stock.
For more details, see NTSM
Page at…
https://navigatethestockmarket.blogspot.com/p/a-system-for-trading-dow-30-stocks-my_8.html
WEDNESDAY MARKET INTERNALS
(NYSE DATA)
My basket of Market Internals remained HOLD. (My basket of Market
Internals is a decent trend-following analysis that is most useful when it
diverges from the Index.)
My current invested position
is about 40% stocks, including stock mutual funds and ETFs. 50% invested in
stocks is a normal, conservative position. (75% is my max stock allocation when
I am confident that markets will continue higher; 30% in stocks is my Bear
market position.)
I trade about 15-20% of the total portfolio using the
momentum-based analysis I provide here. When I see bullish signs, I add a lot more
stocks to the portfolio, usually by using an S&P 500 ETF as I did back in
October 2022 and 2023.
"Like drunken sailors." -Michael Ramirez, political commentary from...
https://michaelpramirez.com/index.html
“Trade what you see; not what you think.” – The Old Fool,
Richard McCranie, trader extraordinaire.
“Far
more money has been lost by investors in preparing for corrections, or
anticipating corrections, than has been lost in the corrections themselves.” -
Peter Lynch, former manager of Fidelity’s Magellan® fund.
"This is maybe the most dangerous market of my
career, and that includes 1987's crash, that includes the savings and loan
debacle market of the early '90s, that includes the 1999 to 2009 lost decade in
the S&P 500 in the dot-com bubble. This is the most difficult market of my
45 years." - Bill Smead, Smead
Value Fund (SMVLX).
BOND MARKET IS WAKING UP (WSJ)
“Treasury auctions are like the plumbing of a toilet: You
only pay attention when something goes wrong. A weak auction drove a market selloff on Wednesday for
the first time since late 2023. There are good reasons to be concerned about
overspill.
The auction itself should have been uneventful. It
involved some $16 billion of 20-year bonds sold to investors—no big deal. But
there was less demand from end-investors than usual, and the price was lower—so
the government’s borrowing cost higher—than had been expected in advance.
The weak demand in itself isn’t great. But the wider
market reaction was horrible... There are three big things going on...
...Firstly, investors are worried about
out-of-control U.S. borrowing. President Trump’s tax bill, passed by the House early Thursday, will increase
already high government debt by trillions...
...Second...the weak bidding at the
auction was a clear signal that there is less demand for long-dated Treasurys...
...third...the ICE U.S. Dollar index ended
down 0.6%—failing to attract buyers despite much higher long-dated Treasury
yields....
This might all blow over, as it did in 2023. Back then,
the symptoms of too much debt went away as inflation came down and the economy
grew, fueling a bull market in stocks and sucking in foreign investors. But the
underlying problem remains, and politicians are yet to be persuaded that it is
worth the pain of fixing. They should do so, before things get messy.” Opinion
at...
https://www.wsj.com/finance/investing/the-bond-market-is-waking-up-to-the-fiscal-mess-in-washington-fcebd153
DURABLE GOODS (WSJ)
"Total orders for goods made to last at least three years,
such as automobiles, planes and electronic equipment, were 6.3% lower in April
than in March, Commerce Department data said Tuesday...Transportation
equipment orders dived 17.1% on month, dragged by a 51.5% decline in nondefense
aircraft and parts. Excluding transportation, total durable goods orders edged
up 0.2% in April.” Story at...
https://www.wsj.com/economy/u-s-durable-goods-orders-tumble-on-lower-aircraft-demand-425f10e0
CONSUMER CONFIDENCE (Conference Board)
“The Conference Board Consumer Confidence Index® increased by 12.3 points in
May to 98.0 (1985=100), up from 85.7 in April... "Consumer confidence
improved in May after five consecutive months of decline," said Stephanie
Guichard, Senior Economist, Global Indicators at The Conference Board.
"The rebound was already visible before the May 12 US-China
trade deal but gained momentum afterwards. The monthly improvement was largely
driven by consumer expectations as all three components of the Expectations
Index—business conditions, employment prospects, and future income—rose from
their April lows.” Story at...
https://www.prnewswire.com/news-releases/us-consumer-confidence-partially-rebounds-in-may-302465852.html
DALLAS FED MANUFACTURING (Advisor Perspectives)
“The Dallas Fed released its Texas Manufacturing
Outlook Survey (TMOS) for May. The general business activity index
rose nearly 21 points, its largest monthly increase since 2020, but remained in
negative territory at -15.3. This marks the fourth straight month of worsening
business conditions.” Story at...
https://www.advisorperspectives.com/dshort/updates/2025/05/27/dallas-fed-manufacturing-business-conditions-worsen-may-2025
MARKET REPORT / ANALYSIS
-Tuesday the S&P 500 rose about 2% to 5922.
-VIX fell about 15% to 18.96.
-The yield on the 10-year Treasury declined to 4.446%
(compared to about this time prior market day).
MY TRADING POSITIONS:
None
CURRENT SUMMARY OF APPROXIMATELY 50 INDICATORS:
Today, of the 50-Indicators
I track, 5 gave Bear-signs and 16 were Bullish. The rest are neutral. (It is
normal to have a lot of neutral indicators since many of the indicators are top
or bottom indicators that will signal only at extremes.)
TODAY’S COMMENT
The daily, bull-bear spread of 50-indicators improved, to
a bullish +11 (11 more Bull indicators than Bear indicators). I consider +5 to
-5 the neutral zone. The 10-dMA of the spread continued down – a bearish sign.
Trump strikes again.
The announcement over the weekend that EU tariffs of 50% would be
delayed for a month drove the markets higher today. Woo-hoo. It’s impossible to
figure out what is coming next so I remain conservatively positioned. Money Market
yields remain in the 4-5% range so I’ll collect some cash while waiting for the
dust to clear.
If the 10-day moving average of the 50-indicator spread
reverses higher I may put some more money to work and increase to a 50% position
in stocks.
BOTTOM LINE
I am neutral/bullish/confused. Isn’t everyone?
ETF - MOMENTUM ANALYSIS:
TODAY’S RANKING OF 15 ETFs (Ranked Daily) ETF ranking
follows:
The top ranked ETF receives
100%. The rest are then ranked based on their momentum relative to the leading
ETF.
*For additional background on
the ETF ranking system see NTSM Page at…
http://navigatethestockmarket.blogspot.com/p/exchange-traded-funds-etf-ranking.html
DOW STOCKS - TODAY’S MOMENTUM RANKING
OF THE DOW 30 STOCKS (Ranked Daily)
The top ranked Stock receives
100%. The rest are then ranked based on their momentum relative to the leading Stock.
For more details, see NTSM
Page at…
https://navigatethestockmarket.blogspot.com/p/a-system-for-trading-dow-30-stocks-my_8.html
TUESDAY MARKET INTERNALS (NYSE
DATA)
My basket of Market Internals improved to HOLD. (My basket of Market Internals is a decent
trend-following analysis that is most useful when it diverges from the Index.)
My current invested position
is about 40% stocks, including stock mutual funds and ETFs. 50% invested in
stocks is a normal, conservative position. (75% is my max stock allocation when
I am confident that markets will continue higher; 30% in stocks is my Bear
market position.)
I trade about 15-20% of the total portfolio using the
momentum-based analysis I provide here. When I see bullish signs, I add a lot more
stocks to the portfolio, usually by using an S&P 500 ETF as I did back in
October 2022 and 2023.
“Trade what you see; not what you think.” – The Old Fool,
Richard McCranie, trader extraordinaire.
“Far
more money has been lost by investors in preparing for corrections, or
anticipating corrections, than has been lost in the corrections themselves.” -
Peter Lynch, former manager of Fidelity’s Magellan® fund.
"One thing that we've heard is that a lot of the
tariff impact to date has actually not shown up in the numbers yet. There's
been a lot of front-running, building inventories and all those sorts of
things. And we are hearing from an increasing number of businesses that those
strategies ... are starting to run their course...If these pre-tariff
strategies have run their course, we're about to see some changes in prices,
and then we're going to learn how consumers are going to respond to that."
– Raphael Bostic, Atlanta Fed Chair at the Atlanta Fed conference in Florida.
“Billionaire investor Ray Dalio on Thursday
sounded another alarm on soaring U.S. debt and deficits, saying it should make
investors fearful of the government bond market. ‘I think we should be afraid
of the bond market,’ Dalio said at an event for the Paley Media Council in
New York. ‘It's like ... I'm a doctor, and I'm looking at the patient, and I've
said, you're having this accumulation, and I can tell you that this is very,
very serious, and I can't tell you the exact time. I would say that if we're really
looking over the next three years, to give or take a year or two, that we're in
that type of a critical, critical situation.’" Story at...
Ray
Dalio says to fear the bond market as deficit becomes critical
“Randy Flowers, senior portfolio manager at Intelligent
Wealth Solutions, believes bond yields could keep a lid on stocks for the
foreseeable future. It’s one reason he expects the U.S. market to remain
rangebound in 2025. “I think bond investors are back in control of the market,
at least in the short term right now. When that happens, that’s usually bad
news for everybody involved, including equity markets,” Flowers said. “We’ll
see if it continues.” Story at...
This
chart shows why investors should be worried about the latest bond-market
selloff
HOME SALES (Nat’l Assoc of realtors)
“Existing-home sales slid 0.5% in April to a seasonally
adjusted annual rate of 4.00 million. Sales retreated 2.0% from one year ago.”
Story at...
https://www.nar.realtor/newsroom/existing-home-sales-edged-lower-by-0-5-in-april
MARKET REPORT / ANALYSIS
-Friday the S&P 500 declined about 0.7% to 5803.
-VIX rose about 10% to 22.29.
-The yield on the 10-year Treasury declined to 4.509%
(compared to about this time prior market day).
MY TRADING POSITIONS:
None
CURRENT SUMMARY OF APPROXIMATELY 50 INDICATORS:
Today, of the 50-Indicators
I track, 7 gave Bear-signs and 13 were Bullish. The rest are neutral. (It is
normal to have a lot of neutral indicators since many of the indicators are top
or bottom indicators that will signal only at extremes.)
TODAY’S COMMENT
The daily, bull-bear spread of 50-indicators improved, to
a slightly bullish +6 (6 more Bull indicators than Bear indicators) I consider +5
to -5 the neutral zone. The 10-dMA of the spread remained down – a bearish sign.
A couple of important bear-signs follow: Utilities are
outperforming the S&P 500; the Smart Money Indicator (based on late-day
action) is bearish; The 10-dMA of Issues advancing on the NYSE (breadth) is now
below 50% indicating that less than half of the issues on the NYSE have been up
over the last 2-weeks.
Repeating yesterday’s comment:
A drop to the lower trend line would put the S&P 500
somewhere around 5600. If this decline continues - and I don’t know if it will
– a significant break below that 5600 zone would signal a likely retest of the
April lows. That has been one of the reasons I am being very conservative now.
A return to the April lows has always been a possibility. Still, given the
strong signals we got during the rally up from the low (Zweig Breadth Thrust;
90% up-volume day; broken downtrend in the charts), a drop to the April lows
probably has a less than 50% chance.
If Trump keeps up his antics, who knows? The Politicians
could still pull a bear market out of the hat.
BOTTOM LINE
I am neutral, but worried. Let’s see where the indicators
go.
ETF - MOMENTUM ANALYSIS:
TODAY’S RANKING OF 15 ETFs (Ranked Daily) ETF ranking
follows:
The top ranked ETF receives
100%. The rest are then ranked based on their momentum relative to the leading
ETF.
*For additional background on
the ETF ranking system see NTSM Page at…
http://navigatethestockmarket.blogspot.com/p/exchange-traded-funds-etf-ranking.html
DOW STOCKS - TODAY’S MOMENTUM RANKING
OF THE DOW 30 STOCKS (Ranked Daily)
The top ranked Stock receives
100%. The rest are then ranked based on their momentum relative to the leading Stock.
For more details, see NTSM
Page at…
https://navigatethestockmarket.blogspot.com/p/a-system-for-trading-dow-30-stocks-my_8.html
THURSDAY FRIDAY MARKET INTERNALS (NYSE
DATA)
My basket of Market Internals slipped to SELL. (My basket of Market
Internals is a decent trend-following analysis that is most useful when it
diverges from the Index.)
My current invested position
is about 40% stocks, including stock mutual funds and ETFs. 50% invested in
stocks is a normal, conservative position. (75% is my max stock allocation when
I am confident that markets will continue higher; 30% in stocks is my Bear
market position.)
I trade about 15-20% of the total portfolio using the
momentum-based analysis I provide here. When I see bullish signs, I add a lot more
stocks to the portfolio, usually by using an S&P 500 ETF as I did back in
October 2022 and 2023.
“Trade what you see; not what you think.” – The Old Fool,
Richard McCranie, trader extraordinaire.
“Far
more money has been lost by investors in preparing for corrections, or
anticipating corrections, than has been lost in the corrections themselves.” -
Peter Lynch, former manager of Fidelity’s Magellan® fund.
"One thing that we've heard is that a lot of the
tariff impact to date has actually not shown up in the numbers yet. There's
been a lot of front-running, building inventories and all those sorts of
things. And we are hearing from an increasing number of businesses that those
strategies ... are starting to run their course...If these pre-tariff
strategies have run their course, we're about to see some changes in prices,
and then we're going to learn how consumers are going to respond to that."
– Raphael Bostic, Atlanta Fed Chair at the Atlanta Fed conference in Florida.
“In fiscal year 2024, the U.S. government paid a total
of $1,126.5 billion in interest on its debt. This represents a
significant increase from the $881 billion paid in the previous year. The
rising cost of borrowing, driven by higher interest rates and a larger national
debt, led to this substantial increase.” From...
https://www.pgpf.org/programs-and-projects/fiscal-policy/monthly-interest-tracker-national-debt/
1.1-trillion dollars per year just to pay the interest on
the debt. Unreal...
MARKET REPORT / ANALYSIS
-Thursday the S&P 500 declined about 3 pts to 5842.
-VIX declined about 3% to 20.28.
-The yield on the 10-year Treasury declined to 4.527%
(compared to about this time prior market day).
MY TRADING POSITIONS:
XLK-sold 5/21
SPY-sold 5/21
CURRENT SUMMARY OF APPROXIMATELY 50 INDICATORS:
Today, of the 50-Indicators
I track, 7 gave Bear-signs and 12 were Bullish. The rest are neutral. (It is
normal to have a lot of neutral indicators since many of the indicators are top
or bottom indicators that will signal only at extremes.)
TODAY’S COMMENT
The daily, bull-bear spread of 50-indicators declined, to
a neutral +5 (5 more Bull indicators than Bear indicators) I consider 5
neutral. The 10-dMA of the spread has turned down – a bearish sign suggesting a
reversal down.
Thursday, there was very high unchanged volume. I know, you’re
tired of reading my standard note:
As I’ve often said, many believe that this indicator
suggests investor confusion at market turning points. Are markets turning back
down? That could always happen and the indicators are suggesting a possible
downturn now. Still, “High-unchanged-volume” is not one of my indicators
because it is often wrong.
A drop to the lower trend line would put the S&P 500 somewhere
around 5600. If this decline continues - and I don’t know if it will – a
significant break below that 5600 zone would signal a likely retest of the April
lows. That has been one of the reasons I am being very conservative now. A
return to the April lows has always been a possibility. Still, given the strong
signals we got during the rally up from the low (Zweig Breadth Thrust; 90%
up-volume day; broken downtrend in the charts), a drop to the April lows probably
has a less than 50% chance.
BOTTOM LINE
I am neutral, but worried. Let’s see where the indicators
go.
ETF - MOMENTUM ANALYSIS:
TODAY’S RANKING OF 15 ETFs (Ranked Daily) ETF ranking
follows:
The top ranked ETF receives
100%. The rest are then ranked based on their momentum relative to the leading
ETF.
*For additional background on
the ETF ranking system see NTSM Page at…
http://navigatethestockmarket.blogspot.com/p/exchange-traded-funds-etf-ranking.html
DOW STOCKS - TODAY’S MOMENTUM RANKING
OF THE DOW 30 STOCKS (Ranked Daily)
The top ranked Stock receives
100%. The rest are then ranked based on their momentum relative to the leading Stock.
For more details, see NTSM
Page at…
https://navigatethestockmarket.blogspot.com/p/a-system-for-trading-dow-30-stocks-my_8.html
THURSDAY MARKET INTERNALS (NYSE
DATA)
My basket of Market Internals remained HOLD. (My basket of Market
Internals is a decent trend-following analysis that is most useful when it
diverges from the Index.)
My current invested position
is about 50% stocks, including stock mutual funds and ETFs. 50% invested in
stocks is a normal, conservative position. (75% is my max stock allocation when
I am confident that markets will continue higher; 30% in stocks is my Bear
market position.)
I trade about 15-20% of the total portfolio using the
momentum-based analysis I provide here. When I see bullish signs, I add a lot more
stocks to the portfolio, usually by using an S&P 500 ETF as I did back in
October 2022 and 2023.
“Trade what you see; not what you think.” – The Old Fool,
Richard McCranie, trader extraordinaire.
“Far
more money has been lost by investors in preparing for corrections, or
anticipating corrections, than has been lost in the corrections themselves.” -
Peter Lynch, former manager of Fidelity’s Magellan® fund.
"One thing that we've heard is that a lot of the
tariff impact to date has actually not shown up in the numbers yet. There's
been a lot of front-running, building inventories and all those sorts of
things. And we are hearing from an increasing number of businesses that those
strategies ... are starting to run their course...If these pre-tariff
strategies have run their course, we're about to see some changes in prices,
and then we're going to learn how consumers are going to respond to that."
– Raphael Bostic, Atlanta Fed Chair at the Atlanta Fed conference in Florida.
HOW EXPENSIVE ARE STOCKS (WSJ)
“The market has absorbed the early blows of President
Trump’s tariffs, making up all its lost ground. Yet that rekindles a Wall Street worry
from earlier this year: By the typical measures, stocks look very pricey right
now... The most common applications of this metric compare stock prices with a
company’s past 12 months of corporate earnings, analysts’ expectations for its
next 12 months of earnings or so-called cyclically adjusted earnings: the
average annual earnings of the past 10 years, adjusted for inflation...
...Just because stocks look expensive by these
measures doesn’t mean they are about to plunge. In periods such as
the Roaring ’20s and the 1990s tech bubble, frothy markets defied gravity for
years.” Story at...
https://www.wsj.com/finance/stocks/stock-valuations-investors-76d1daa6
FOREIGN INVESTORS BAILING? (MoneyWise)
“U.S. stocks had been outperforming the rest of the world
for years — until a slew of tariffs and trade policies spooked investors and
caused global markets to plunge in March. Now, some foreign investors are
rethinking their exposure to U.S. markets. That’s according to economic expert
Rebecca Patterson, who previously served as Bridgewater’s chief investment
strategist, on an episode of CNBC’s Fast Money.” Story at...
Foreign
investors losing faith in the US
MARKET REPORT / ANALYSIS
-Wednesday the S&P 500 declined about 1.6% to 5845.
-VIX rose about 15% to 20.87.
-The yield on the 10-year Treasury rose to 4.597%
(compared to about this time prior market day).
MY TRADING POSITIONS:
XLK-sold 5/21
SPY-sold 5/28
CURRENT SUMMARY OF APPROXIMATELY 50 INDICATORS:
Today, of the 50-Indicators
I track, 6 gave Bear-signs and 15 were Bullish. The rest are neutral. (It is
normal to have a lot of neutral indicators since many of the indicators are top
or bottom indicators that will signal only at extremes.)
TODAY’S COMMENT
“Stocks sold off on Wednesday, pressured by a sharp
spike higher in Treasury yields as traders grew worried that a new
U.S. budget bill would put even more stress on the country’s already large
deficit.” - CNBC
My cmt: Could be. It’s always difficult to pin market
moves directly on news.
The daily, bull-bear spread of 50-indicators declined,
but remained bullish at +9 (9 more Bull indicators than Bear indicators) I
consider 5 neutral. The 10-dMA of the spread turned down late in the day – a bearish
sign suggesting a possible reversal down.
I took profits in my trading positions, dropping my
invested position to about 40%. This may
be too conservative, but it was a late day decision based on the 10-dMA of my
50-indicator spread. That stat had been flat
until I checked it around 3:30 so I sold. There’s a lot of complacency in the
markets. I noted (somewhere) that Jim
Kramer was telling his faithful to ignore the market issues and buy-buy-buy. He
might be right, but everyone is in that camp now, so I worry. Tariffs look like
an inflation maker. Bond markets seem to be worried about the Federal deficit,
although they haven’t worried about deficits for 10-years. Are they really
worried now? I don’t know, but my mantra is caution and preservation of capital.
Sorry I didn’t have time to post this before my stock sales.
Wednesday was a statistically significant down-day. That
just means that the price-volume move exceeded my statistical parameters.
Statistics show that a statistically-significant, down-day is followed by an up-day
about 60% of the time.
BOTTOM LINE
I am neutral. Let’s see where the indicators go.
ETF - MOMENTUM ANALYSIS:
TODAY’S RANKING OF 15 ETFs (Ranked Daily) ETF ranking
follows:
The top ranked ETF receives
100%. The rest are then ranked based on their momentum relative to the leading
ETF.
*For additional background on
the ETF ranking system see NTSM Page at…
http://navigatethestockmarket.blogspot.com/p/exchange-traded-funds-etf-ranking.html
DOW STOCKS - TODAY’S MOMENTUM RANKING
OF THE DOW 30 STOCKS (Ranked Daily)
The top ranked Stock receives
100%. The rest are then ranked based on their momentum relative to the leading Stock.
For more details, see NTSM
Page at…
https://navigatethestockmarket.blogspot.com/p/a-system-for-trading-dow-30-stocks-my_8.html
WEDNESDAY MARKET INTERNALS
(NYSE DATA)
My basket of Market Internals remained HOLD. (My basket of Market
Internals is a decent trend-following analysis that is most useful when it
diverges from the Index.)
My current invested position
is about 40% stocks, including stock mutual funds and ETFs so I am conservatively positioned. 50% invested in
stocks is a normal position for me. (75% is my max stock allocation when
I am confident that markets will continue higher; 30% in stocks is my Bear
market position.)
I trade about 15-20% of the total portfolio using the
momentum-based analysis I provide here. When I see bullish signs, I add a lot more
stocks to the portfolio, usually by using an S&P 500 ETF as I did back in
October 2022 and 2023.