... Momentum Trading DOW Stocks & ETFs … Stock Market Analysis ...
“Trade what you see; not what you think.” – The Old Fool,
Richard McCranie, trader extraordinaire.
“Far
more money has been lost by investors in preparing for corrections, or
anticipating corrections, than has been lost in the corrections themselves.” -
Peter Lynch, former manager of Fidelity’s Magellan® fund.
“The recent tariffs will likely increase inflation and
are causing many to consider a greater probability of a recession, and even
with the recent decline in market values, prices remain relatively high.” - Jamie
Dimon, JPMorgan CEO and chairman, in a letter to shareholders on April 7.
“Two Federal Reserve officials, including New York Fed
chief John Williams, suggested policymakers may not be ready to lower interest
rates before September as they confront a murky economic outlook. “It’s not
going to be that in June we’re going to understand what’s happening here, or in
July,” Williams said Monday at a conference organized by the Mortgage Bankers
Association. “It’s going to be a process of collecting data, getting a better
picture, and watching things as they develop.” Story at...
Fed
Officials Signal Rates Likely to Stay on Hold Until at Least September
MARKET REPORT / ANALYSIS
-Tuesday the S&P 500 declined about 0.4% to 5940.
-VIX declined about 0.3% to 18.09.
-The yield on the 10-year Treasury rose to 4.485%
(compared to about this time prior market day).
MY TRADING POSITIONS:
XLK-added 4/28
SPY-added 4/28
CURRENT SUMMARY OF APPROXIMATELY 50 INDICATORS:
Today, of the 50-Indicators
I track, 5 gave Bear-signs and 18 were Bullish. The rest are neutral. (It is
normal to have a lot of neutral indicators since many of the indicators are top
or bottom indicators that will signal only at extremes.)
TODAY’S COMMENT
The daily, bull-bear spread of 50-indicators declined,
but remained a bullish +13 (13 more Bull indicators than Bear indicators) I
consider 5 neutral. The 10-dMA of the spread was essentially flat – a neutral
sign suggesting a possible reversal.
After 17 days up in the last month for the S&P 500, a
down day was to be expected. As noted yesterday, I’ll treat the long run-up as
a warning and watch for other signs that might signal a reversal.
BOTTOM LINE
I am cautiously bullish.
ETF - MOMENTUM ANALYSIS:
TODAY’S RANKING OF 15 ETFs (Ranked Daily) ETF ranking
follows:
The top ranked ETF receives
100%. The rest are then ranked based on their momentum relative to the leading
ETF.
*For additional background on
the ETF ranking system see NTSM Page at…
http://navigatethestockmarket.blogspot.com/p/exchange-traded-funds-etf-ranking.html
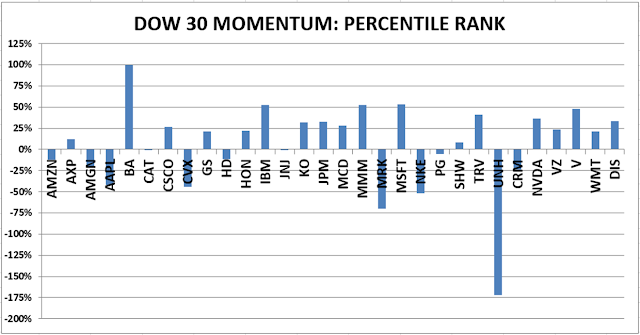
DOW STOCKS - TODAY’S MOMENTUM RANKING
OF THE DOW 30 STOCKS (Ranked Daily)
The top ranked Stock receives
100%. The rest are then ranked based on their momentum relative to the leading Stock.
For more details, see NTSM
Page at…
https://navigatethestockmarket.blogspot.com/p/a-system-for-trading-dow-30-stocks-my_8.html
TUESDAY MARKET INTERNALS (NYSE
DATA)
My basket of Market Internals slipped to HOLD. (My basket of Market
Internals is a decent trend-following analysis that is most useful when it
diverges from the Index.)
My current invested position
is about 50% stocks, including stock mutual funds and ETFs. 50% invested in
stocks is a normal, conservative position. (75% is my max stock allocation when
I am confident that markets will continue higher; 30% in stocks is my Bear
market position.)
I trade about 15-20% of the total portfolio using the
momentum-based analysis I provide here. When I see bullish signs, I add a lot more
stocks to the portfolio, usually by using an S&P 500 ETF as I did back in
October 2022 and 2023.